Admit rate has ranged 74%–82% over the last 5 years — notably volatile, though the latest figure above (70%) falls outside that window. Source: IPEDS via Urban Institute.
Acceptance & SAT from Common Data Set / IPEDS; net price, earnings & graduation from the U.S. Dept. of Education College Scorecard. Figures lag ~1–2 years — verify with the school.
Merrimack College is a private, Augustinian Catholic institution in North Andover, Massachusetts, where a pragmatic, career-focused education meets a spirited, tight-knit campus culture. It’s a place where business and health sciences dominate the academic landscape, Division I athletics fuel a palpable school spirit, and a 70% acceptance rate signals an accessible, yet increasingly selective, path to a solid return on investment. Think of it as a classic New England college experience—complete with Greek life and a majority of students living on campus—that’s intently focused on launching graduates into the workforce.
Admission requirements
Test-blind — scores not considered
Required
High school transcript
Grade point average
Letters of recommendation
College-prep program
TOEFL (non-native English)
Source: IPEDS Admissions survey (2022) via Urban Institute. Covers formal factors only — it does not reflect essays, extracurriculars, or other holistic criteria.
More details
Undergrad enrollment
3,916
In-state tuition
$53,962
Out-of-state tuition
$53,962
Graduation Rate
70%
On-Campus Housing
60%
Median Earnings (10yr)
$75,584
Division I Varsity Teams
28
Most Popular Major (2024 Grads)
Business (37%)
First-Year Students Receiving Need-Based Aid
70%
Outcomes & value
Outcomes & value
Median earnings (10 yr)
$75,584
Value (earnings ÷ net price)
2.0×
Median debt at graduation
$27,000
Graduation rate
70%
First-year retention
79%
Reducing loan balance (3 yr)
78%
Pell (lower-income) share
16%
First-gen share (among federal-aid recipients)
21%
Financial health
3.0 / 3.0Meets the federal financial-responsibility standard
U.S. Dept. of Education Financial Responsibility Composite Score (FY2022-23). Scale −1.0 to 3.0; ≥1.5 meets the standard. Reported for private nonprofit & for-profit institutions only — public universities are state-backed and not scored, so this is a stability signal, not a ranking.
Top-earning majors
Median earnings by field of study (highest credential), ~2 years after completion.
Business Administration, Management and Operations$44,327
Communication and Media Studies$38,289
Psychology, General$36,141
Physiology, Pathology and Related Sciences$35,600
Education, General$29,685
Human Development, Family Studies, and Related Services
Campus & location
Campus safety
On-campus violent crimes (2024)
7
Per 1,000 students
1.23
On-campus criminal offenses classed as violent (murder/non-negligent manslaughter, rape, robbery, aggravated assault) for the most recent reported year. Source: U.S. Dept. of Education Campus Safety and Security (Clery Act). Counts reflect what’s reported to the school, and urban campuses often report more partly due to non-student incidents nearby — read alongside campus size and setting, not as a standalone safety verdict.
Climate
Pleasant days / yr
94
Summer high
81°F
Winter low
24°F
Annual rain
49.8"
Annual snow
40.2"
Natural-hazard risk
Relatively High
Pleasant days counts days per year with a mean temperature of 55–75°F, a high at or below 90°F, a low at or above 45°F, and little precipitation — a transparent comfort measure, not a weighting we invented. Computed from Open-Meteo ERA5 daily history (2019–2023). Natural-hazard risk is the county’s composite rating from the FEMA National Risk Index.
Deep dive — research, future-scholar output & economic mobility▾
Research output
Institutional h-index
91
Scholarly works
2,256
Institutional research volume and impact from OpenAlex. The h-index reflects large research universities and will be low for teaching-focused liberal-arts colleges — not a measure of undergraduate quality.
Economic mobility
Mobility rate
0.8%
Bottom → top quintile
27%
From bottom quintile
3%
Mobility rate = the share of students who both start in the bottom household-income quintile and reach the top quintile; bottom → top is that chance conditional on starting at the bottom. Source: Opportunity Insights Mobility Report Cards (Chetty, Friedman, Saez, Turner & Yagan). Reflects 1980–82 birth cohorts, so it’s directional, not current.
Quick answers
What is the acceptance rate at Merrimack College?
Merrimack College's acceptance rate is approximately 70% (North Andover, MA), based on the most recent figures we compiled from public and primary sources.
How much does Merrimack College cost?
At Merrimack College, the average net price (after aid) is about $37,927 per year. Actual cost varies with financial aid and residency.
How many undergraduates attend Merrimack College?
Merrimack College enrolls approximately 3,916 undergraduate students.
Where is Merrimack College located?
Merrimack College is located in North Andover, MA.
Admissions
Merrimack’s admissions process is best described as ‘accessible but discerning.’ With an of 70%, the college reviews a significant volume of applications—over 14,000 for a recent cycle—but admits a clear majority. However, this overall figure masks a more selective early acceptance rate of 83.8%, suggesting a notable advantage for students who apply early. The college accepts the Common Application with no application fee and, notably, does not require standardized test scores. The admitted student profile reveals a solid academic core: 48% of enrolled students in a recent class had a high school GPA of 3.5 or above, with another 28% in the 3.0-3.4 range. While the middle 50% SAT range for admitted students is reported as 1070–1240, the policy means these figures represent only those who chose to submit scores. The process appears straightforward, prioritizing a consistent academic record over ultra-competitive scores.
Earnings = median of students working ~10 years after entry; debt = median of graduates. Value divides 10-yr earnings by one year’s net price — read it as earnings per dollar of annual cost, not a full lifetime ROI; it favors lower-cost schools. Source: U.S. Dept. of Education College Scorecard. Figures lag ~2 years and reflect all students, not your intended major.
$28,816
Natural Resources Conservation and Research$25,194
Criminal Justice and Corrections$25,194
Source: U.S. Dept. of Education College Scorecard (field-of-study earnings). Figures cover graduates who received federal aid and lag ~2 years; not all programs report data.
Merrimack’s academic identity is defined by breadth and practicality. The college offers more than 100 undergraduate academic programs, with ample opportunities for majors, minors, and double majors across disciplines. The curriculum is unmistakably career-oriented. For the class of 2024, a commanding 37% of graduates majored in Business, Management, Marketing, and Related Support Services. Health Professions and Related Programs followed as the second most popular field at 13%. This professional focus is complemented by traditional liberal arts offerings within the School of Arts and Sciences, including majors in English, philosophy, and history. A key selling point, frequently highlighted in student impressions, is the small class size, which fosters a more personalized and supportive learning environment. The academic structure is designed for flexibility and acceleration, with over 40 graduate and accelerated programs available, allowing ambitious undergraduates a clear pathway to advanced degrees.
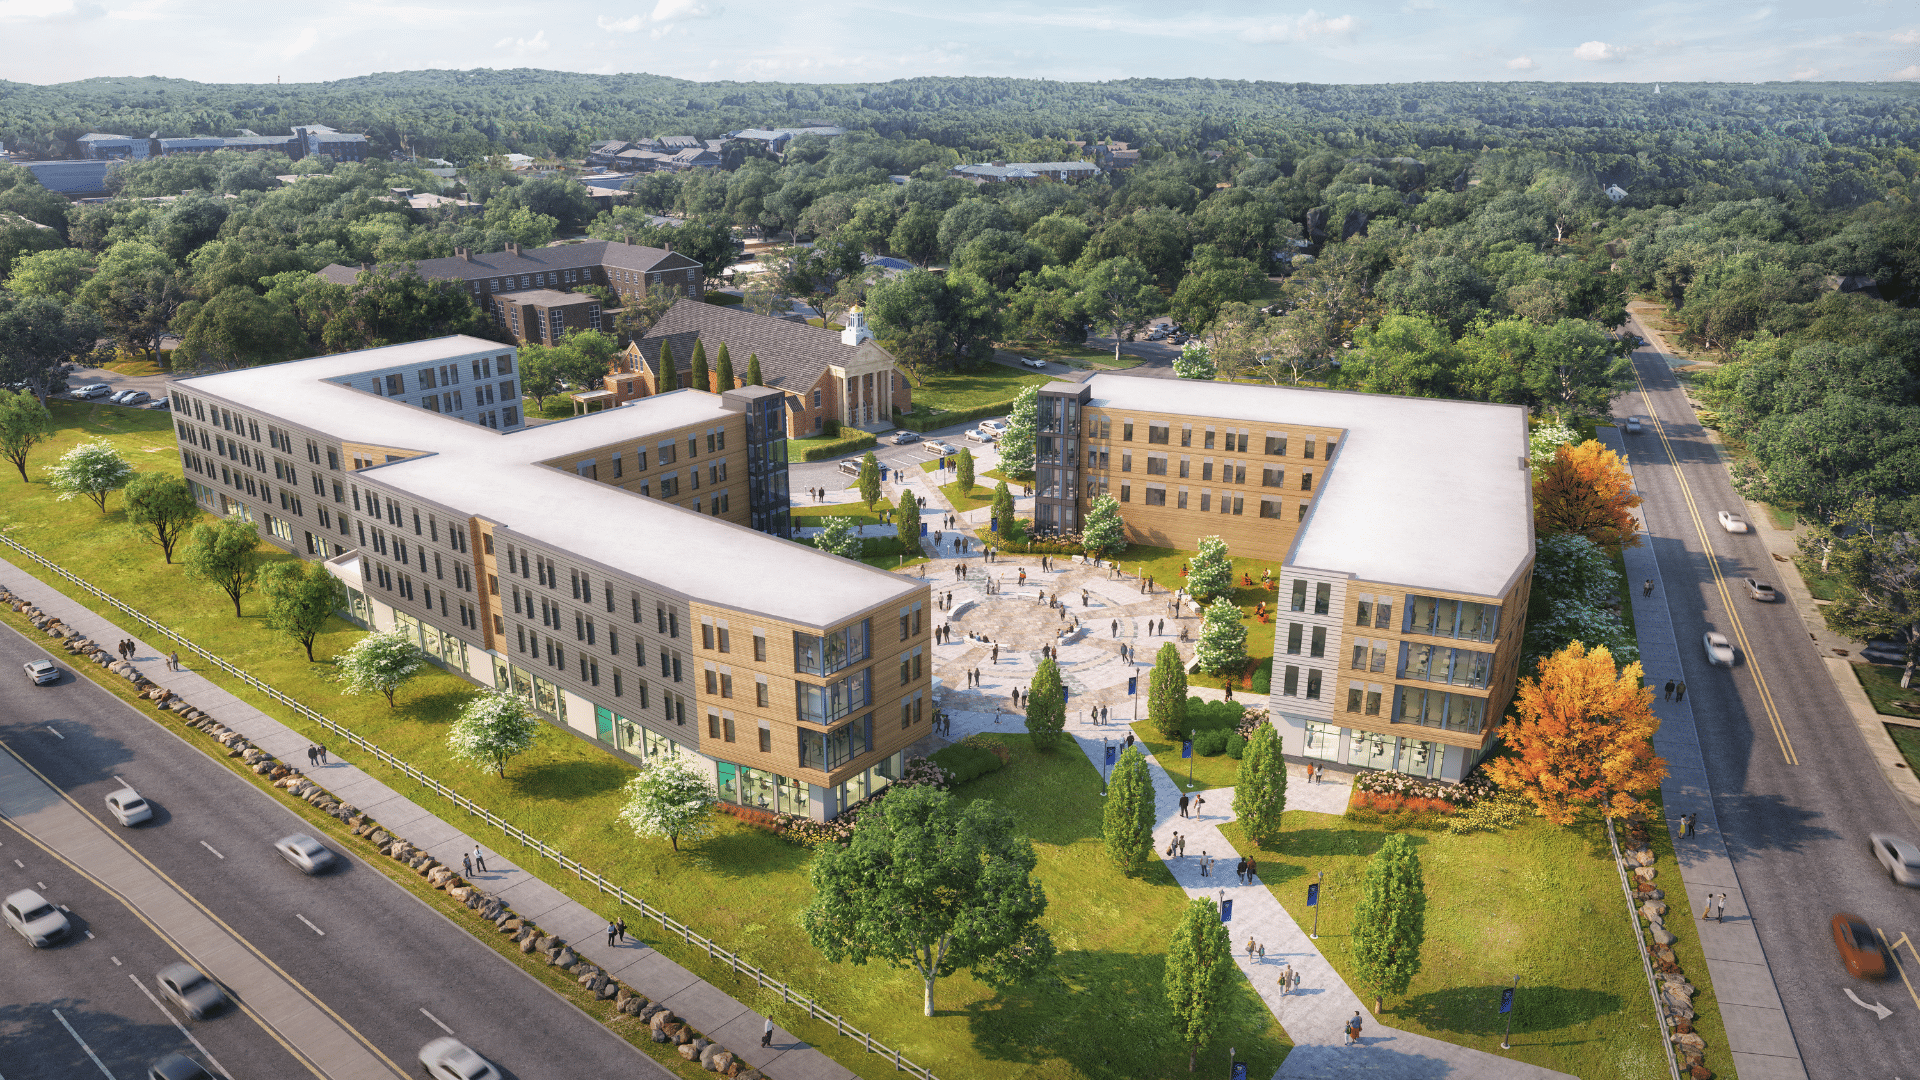
Life at Merrimack revolves around a traditional, residential campus experience with a heavy dose of athletic spirit. A majority of students—60%—live in college-owned, -operated, or -affiliated housing, creating a self-contained, communal environment. The campus culture is significantly shaped by its 28 Division I varsity teams; the college describes its ‘one-of-a-kind school spirit’ as a ‘big part of campus culture.’ Beyond the arena, student life is organized through a robust network of clubs, organizations, and Greek life, all promoted actively through dedicated social media channels. The campus offers dining, housing, fitness and recreation facilities, and fosters ‘lifelong friendships’ and an ‘energetic campus’ atmosphere. The location in North Andover provides access to local bars and restaurants, balancing the on-campus community with off-campus options.
Merrimack positions itself as an engine for employability. Recent first-destination data shows that within nine months of graduation, 55.7% of graduates were employed, 25.9% were pursuing further education, 10.2% were both working and continuing their education, and 5.7% were seeking employment. The college has been recognized by rankings like Money's Best Colleges in America for its performance on outcomes measures, including graduation rates and alumni salaries. Specific program graduates, such as those in Civil Engineering and Computer Science, are noted to report strong incomes. Earnings growth is evident post-graduation, with reported averages rising from about $47,761 one year out to $66,201 five years after graduation.
Merrimack’s stated comprehensive cost—tuition, fees, room, and board—is significant, but the college uses institutional aid aggressively to lower the for most families. The average need-based scholarship or grant awarded to first-year students is $32,529, and 70% of first-year students receive . Furthermore, 99% of full-time, first-year undergraduates receive some form of grant or scholarship aid. The college provides a Net Price Calculator to help families estimate their actual cost based on specific financial circumstances. It’s important to note that Merrimack’s institutional funding is awarded based on both academic performance and demonstrated financial need, meaning aid packages often blend merit and need-based components. The college does not advertise a ‘no-loan’ policy or a guarantee to meet 100% of demonstrated need without loans.
Merrimack College carves out a distinct niche by marrying a no-frills, professionally focused education with an all-in, spirited campus life. It’s not trying to be an ultra-selective liberal arts college; instead, it offers a clear-value proposition: a supportive, small-class environment where you can major in business or health sciences, live on a traditional campus, and cheer for Division I hockey—all while receiving substantial financial aid that makes the private college sticker price more manageable. Its recent move to Division I athletics isn't just about sports; it has fundamentally amplified school spirit and campus identity. For students seeking a classic college experience with a direct through-line to a career—and who thrive in a community where athletics and campus involvement are central—Merrimack provides a cohesive and purposeful package that many similar institutions struggle to match.
Merrimack College seal · sourceMerrimack College - Wikipedia · sourceAbout Merrimack College, Massachusetts | Merrimack Schools · sourceWhat Does Merrimack Look Like | Merrimack College · source