Admit rate has ranged 63%–77% over the last 5 years — notably volatile. Source: IPEDS via Urban Institute.
Acceptance & SAT from Common Data Set / IPEDS; net price, earnings & graduation from the U.S. Dept. of Education College Scorecard. Figures lag ~1–2 years — verify with the school.
Springfield College operates with a distinct, almost vocational clarity: it's a place where the mind, body, and spirit are trained in equal measure for careers in service. The campus vibe is intensely communal—84% of students live on campus—and the academic focus is sharply pragmatic, dominated by health professions, recreation, and business. This isn't a school for abstract theorizing; it's for students who want to graduate ready to coach, rehabilitate, manage, and lead.
Admission requirements
Test-optional — scores considered if submitted
Required
High school transcript
Grade point average
Letters of recommendation
College-prep program
TOEFL (non-native English)
Considered (not required)
Class rank
Test scores (SAT/ACT)
Demonstrated competencies
Source: IPEDS Admissions survey (2022) via Urban Institute. Covers formal factors only — it does not reflect essays, extracurriculars, or other holistic criteria.
More details
Undergrad enrollment
1,751
In-state tuition
$45,174
Out-of-state tuition
$45,174
Early Decision
Available
Graduation Rate
74%
On-Campus Housing
84%
First-Year Retention
81%
Median Earnings (10yr)
$48,036
Outcomes & value
Outcomes & value
Median earnings (10 yr)
$48,036
Value (earnings ÷ net price)
1.6×
Median debt at graduation
$26,250
Graduation rate
74%
First-year retention
81%
Reducing loan balance (3 yr)
55%
Pell (lower-income) share
22%
First-gen share (among federal-aid recipients)
31%
Financial health
2.1 / 3.0Meets the federal financial-responsibility standard
U.S. Dept. of Education Financial Responsibility Composite Score (FY2022-23). Scale −1.0 to 3.0; ≥1.5 meets the standard. Reported for private nonprofit & for-profit institutions only — public universities are state-backed and not scored, so this is a stability signal, not a ranking.
Top-earning majors
Median earnings by field of study (highest credential), ~2 years after completion.
Business Administration, Management and Operations$45,696
Criminal Justice and Corrections$36,141
Community Organization and Advocacy$34,586
Sports, Kinesiology, and Physical Education/Fitness$32,925
Biological and Biomedical Sciences, Other$30,771
Allied Health Diagnostic, Intervention, and Treatment Professions
Campus & location
Campus safety
On-campus violent crimes (2024)
3
Per 1,000 students
1.16
On-campus criminal offenses classed as violent (murder/non-negligent manslaughter, rape, robbery, aggravated assault) for the most recent reported year. Source: U.S. Dept. of Education Campus Safety and Security (Clery Act). Counts reflect what’s reported to the school, and urban campuses often report more partly due to non-student incidents nearby — read alongside campus size and setting, not as a standalone safety verdict.
Climate
Pleasant days / yr
87
Summer high
83°F
Winter low
24°F
Annual rain
50.5"
Annual snow
29.1"
Natural-hazard risk
Relatively Moderate
Pleasant days counts days per year with a mean temperature of 55–75°F, a high at or below 90°F, a low at or above 45°F, and little precipitation — a transparent comfort measure, not a weighting we invented. Computed from Open-Meteo ERA5 daily history (2019–2023). Natural-hazard risk is the county’s composite rating from the FEMA National Risk Index.
Deep dive — research, future-scholar output & economic mobility▾
Research output
Institutional h-index
111
Scholarly works
3,425
Institutional research volume and impact from OpenAlex. The h-index reflects large research universities and will be low for teaching-focused liberal-arts colleges — not a measure of undergraduate quality.
Economic mobility
Mobility rate
0.6%
Bottom → top quintile
22%
From bottom quintile
3%
Mobility rate = the share of students who both start in the bottom household-income quintile and reach the top quintile; bottom → top is that chance conditional on starting at the bottom. Source: Opportunity Insights Mobility Report Cards (Chetty, Friedman, Saez, Turner & Yagan). Reflects 1980–82 birth cohorts, so it’s directional, not current.
Quick answers
What is the acceptance rate at Springfield College?
Springfield College's acceptance rate is approximately 72% (Springfield, MA), based on the most recent figures we compiled from public and primary sources.
What SAT score do you need for Springfield College?
Admitted students at Springfield College typically score 1080–1330 on the SAT (the middle-50% range). Scores outside this band are still admitted, especially with strong applications.
How much does Springfield College cost?
At Springfield College, the average net price (after aid) is about $30,587 per year. Actual cost varies with financial aid and residency.
How many undergraduates attend Springfield College?
Springfield College enrolls approximately 1,751 undergraduate students.
Where is Springfield College located?
Springfield College is located in Springfield, MA.
Admissions
Springfield College's admissions process is characterized by accessibility and a holistic, student-centered approach. With a 72% acceptance rate, the college is less selective, offering a realistic pathway for a broad range of applicants. The middle 50% SAT range for admitted students is 1080–1330, and the institution maintains a test-optional policy for all programs, meaning SAT or ACT scores may be submitted but are not required and will not negatively impact an admissions decision. The college offers an Early Decision option for highly qualified students for whom Springfield is a first choice, signaling a commitment to enrolling students who are deeply invested in the college's unique mission. While the outlines the importance of various factors in admissions decisions, specific weightings for Springfield (such as the consideration of demonstrated interest) are not detailed in the provided sources. The process appears designed to identify students who will thrive in its close-knit, service-oriented community rather than to filter by scores alone.
Earnings = median of students working ~10 years after entry; debt = median of graduates. Value divides 10-yr earnings by one year’s net price — read it as earnings per dollar of annual cost, not a full lifetime ROI; it favors lower-cost schools. Source: U.S. Dept. of Education College Scorecard. Figures lag ~2 years and reflect all students, not your intended major.
$30,409
Psychology, General$23,351
Source: U.S. Dept. of Education College Scorecard (field-of-study earnings). Figures cover graduates who received federal aid and lag ~2 years; not all programs report data.
Academics at Springfield are defined by practical, hands-on preparation for specific service-oriented careers. The college offers more than 40 undergraduate majors, with the most popular falling squarely within Health Professions and Related Programs; Parks, Recreation, Leisure, Fitness, and Kinesiology; and Business. This isn't a liberal arts college in the traditional sense; the curriculum is professionally focused, aimed at producing practitioners—think athletic trainers, physical therapists, sport managers, and recreation leaders. The School of Arts and Sciences provides a counterbalance with notable interdisciplinary majors like Computer Science/Criminal Justice, Environmental Studies, Art and Design, and a new Data Science major, but the institutional heart beats strongest for applied fields. Students consistently praise the small class sizes and supportive, approachable professors, which foster a strong sense of academic community. Courses are delivered in flexible formats, including on-campus, synchronous online, and 100% online asynchronous, catering to both traditional and non-traditional students.
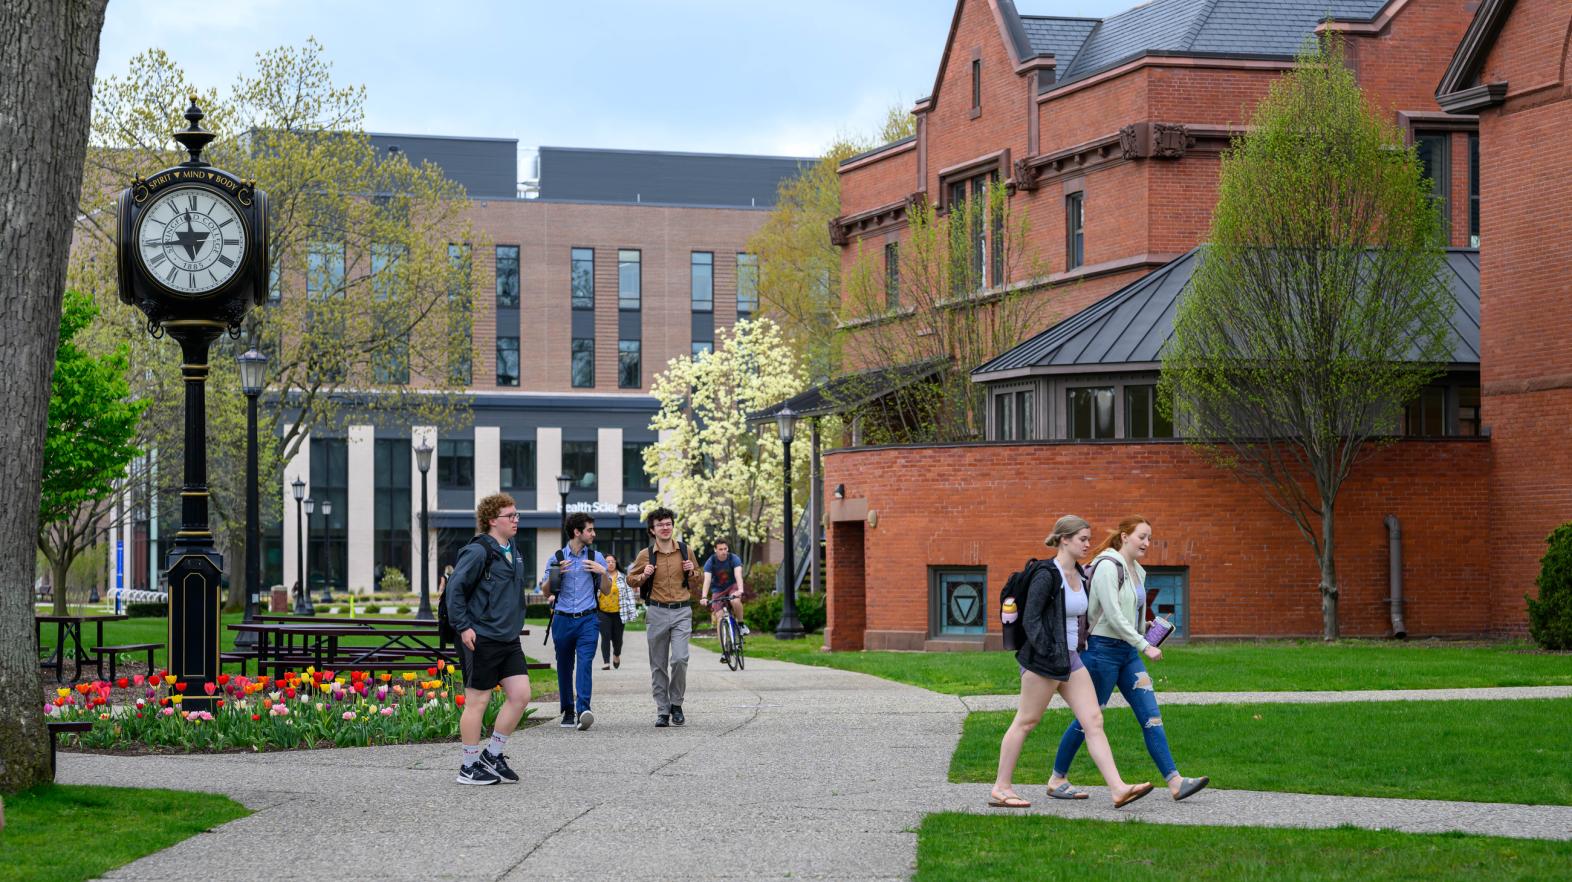
Life at Springfield is overwhelmingly residential and communal, creating a tight-knit, all-in campus culture. A striking 84% of students live in college-owned, -operated, or -affiliated housing, making it a place where the line between academic and social life is blurred. The Division of Campus Life and Community Engagement is mission-driven, aiming to cultivate a community where students thrive through a co-curricular experience that centers belonging, meaning, and purpose. This translates into a busy calendar of events, clubs, organizations, and volunteer options designed to engage the 'whole person.' The student body and faculty are repeatedly described as friendly, supportive, and welcoming, which reinforces the college's self-concept as a holistic learning environment promoting student growth and engaged citizenship. The official Instagram account underscores this, highlighting performances and events that showcase student work and invite community participation, embodying the college's motto of educating 'spirit, mind, and body—for leadership in service to others.'
Springfield College graduates students who are ready to work, and its outcomes reflect a solid return on a professionally oriented education. The four-year graduation rate is 74%, and the six-year rate is 78%, figures that place it above the national midpoint for four-year colleges. This suggests students are progressing efficiently through their programs. Perhaps most telling is the median earnings 10 years after entry: $48,036. This figure, while not stratospheric, indicates a stable financial foundation for graduates, many of whom enter fields like health, recreation, and business. The college also reports a strong first-year retention rate of 81%, a sign that students quickly find their footing and choose to continue. The overall picture is one of a college that successfully shepherds its students to completion and into the workforce with measurable, mid-career earning potential.
Springfield College is a significant financial investment, with an average net price after aid of $30,587. The college is proactive in offering financial assistance, with 100% of full-time, first-year undergraduate students receiving assistance through scholarships and grants in the current academic year. The average financial aid package is reported as $33,028. Families are directed to use the Calculator for a personalized estimate. The college offers a variety of programs ranging from need-based financial aid to family loan programs. However, the provided sources do not indicate that Springfield College has a policy of meeting 100% of demonstrated financial need for all admitted students, nor do they describe a specific 'no-loan' policy where loans are excluded from aid packages for certain income brackets. The financial aid office states that financial need has no bearing on the admission decision, ensuring aid is considered separately.
Springfield College stands out not for prestige or selectivity, but for its unwavering commitment to a specific type of student and a concrete educational philosophy. It is unapologetically a professional training ground with a soul, built on the triad of 'spirit, mind, and body.' While many colleges pay lip service to 'educating the whole person,' Springfield's entire ecosystem—from its dominant majors in health and human services to its intensely residential community (84% on-campus)—is engineered to do just that. It's a place where future athletic trainers, physical education teachers, and nonprofit managers don't just learn theory; they live in a community that models the service-oriented leadership they're being trained to provide. The high retention (81%) and solid graduation rates (74% in 4 years) suggest this model works; students who buy into the mission tend to stay and finish. In a landscape of increasingly generic liberal arts education, Springfield offers a focused, pragmatic, and communal alternative for students who know they want to build a career helping others.
Springfield College seal · sourceSpringfield College - Keep Moving · sourceAbout Springfield College | Springfield College | Get in on our · sourceStudent Life at Springfield College | Springfield College · source
.jpg?width=1600)