Loading…
← All schools
Tulsa Technology Center
Tulsa, OKpublictulsatech.edu
Avg net price
$5,723
Earnings (10 yr)
$41,793
Acceptance & SAT from Common Data Set / IPEDS; net price, earnings & graduation from the U.S. Dept. of Education College Scorecard. Figures lag ~1–2 years — verify with the school.
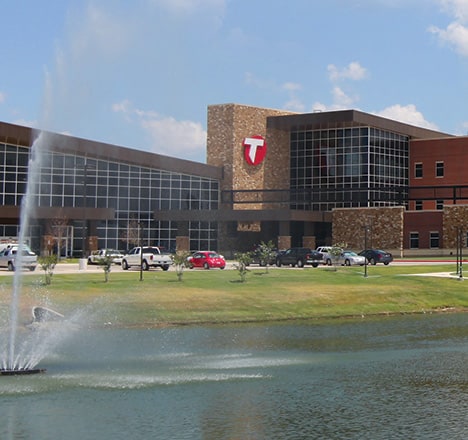
Tulsa Technology Center is not a traditional university but a sprawling, career-focused public technical district that operates with the pragmatic urgency of a jobs pipeline. It offers over 80 full-time career training programs to more than 4,000 students, functioning as a direct, high-efficiency bridge to skilled trades and technical fields in the Tulsa region. With an open-access admissions philosophy and a relentless focus on measurable outcomes—95% positive placement, 92% completion—it’s a place where education is defined not by selectivity, but by employability.
More details
- Undergrad enrollment
- 1,409
- Graduation Rate
- 81%
- Full-time Programs
- 80+
- Students in Grant Aid
- 75%
- Median Earnings (10yr)
- $41,793
- Positive Placement Rate
- 95%
- Completion & Retention Rate
- 92%
Outcomes & value
Outcomes & value
- Median earnings (10 yr)
- $41,793
- Value (earnings ÷ net price)
- 7.3×
- Pell (lower-income) share
- 14%
- First-gen share (among federal-aid recipients)
- 49%
Earnings = median of students working ~10 years after entry; debt = median of graduates. Value divides 10-yr earnings by one year’s net price — read it as earnings per dollar of annual cost, not a full lifetime ROI; it favors lower-cost schools. Source: U.S. Dept. of Education College Scorecard. Figures lag ~2 years and reflect all students, not your intended major.
Campus & location
Campus safety
- On-campus violent crimes (2024)
- 0
On-campus criminal offenses classed as violent (murder/non-negligent manslaughter, rape, robbery, aggravated assault) for the most recent reported year. Source: U.S. Dept. of Education Campus Safety and Security (Clery Act). Counts reflect what’s reported to the school, and urban campuses often report more partly due to non-student incidents nearby — read alongside campus size and setting, not as a standalone safety verdict.
Climate
- Pleasant days / yr
- 75
- Summer high
- 90°F
- Winter low
- 33°F
- Annual rain
- 49.7"
- Annual snow
- 7.1"
- Natural-hazard risk
- Relatively High
Pleasant days counts days per year with a mean temperature of 55–75°F, a high at or below 90°F, a low at or above 45°F, and little precipitation — a transparent comfort measure, not a weighting we invented. Computed from Open-Meteo ERA5 daily history (2019–2023). Natural-hazard risk is the county’s composite rating from the FEMA National Risk Index.
Quick answers
- How much does Tulsa Technology Center cost?
- At Tulsa Technology Center, the average net price (after aid) is about $5,723 per year. Actual cost varies with financial aid and residency.
- How many undergraduates attend Tulsa Technology Center?
- Tulsa Technology Center enrolls approximately 1,409 undergraduate students.
- Where is Tulsa Technology Center located?
- Tulsa Technology Center is located in Tulsa, OK.
Admissions
Admissions at Tulsa Tech is defined by accessibility, not exclusivity. The institution reports a 100% , reflecting its open-access mission to provide career training to a broad population. The process is straightforward: prospective students for full-time programs begin by consulting with counselors who advise on program selection. While the school is open-admission, some programs may have prerequisites or require assessment; for high school applicants, reading and math scores from the Pre-ACT, ACT, PSAT, or SAT are accepted for placement purposes. There is no indication of an early decision or early action process, nor is demonstrated interest a formal factor—this is a system built on capacity and fit, not on crafting a competitive class. The primary gatekeepers are program availability and a student's readiness for the technical curriculum, not GPA or test score thresholds.
Academics
The academic model is singularly vocational, built around 'over 80 full-time career programs' and 'hundreds of part-time classes.' Instruction is intensely practical, designed to deliver 'the training you need to get to work.' Programs emphasize the development of solid math, science, and technical skills as a foundation for long-term careers. The curriculum is classical in a technical sense, focusing on the core competencies of specific trades and technologies. The district tracks and publicly highlights three key educational outcome metrics: a 95% positive placement rate (meaning graduates are employed, in the military, or continuing their education), a 92% completion and retention rate, and 90% participation in Career and Technical Student Organizations (CTSOs). This triad of metrics—placement, completion, and extracurricular engagement—defines the institution's success far more than traditional academic rankings. In 2024, the school awarded 2,623 degrees and certificates across all programs, with a nearly even gender split (48.1% to women, 51.9% to men).
Compare Tulsa Technology Center
vs Northwestern Oklahoma State Universityvs University of Science and Arts of Oklahomavs Florida Polytechnic Universityvs Elizabeth City State University
See colleges similar to Tulsa Technology Center →Sources
- Common Datasets 2024-2025
- Common Data Set - Institutional Research & Planning
- Common Data Set | Institutional Effectiveness
- Common Data Set: Home
- Common Data Set 2021-2022
- How To Use a Common Data Set
- Apply | Tulsa Technology Center
- Tulsa Technology Center
- Admissions & Financial Aid | Tulsa Technology Center
- Tulsa Technology Center-Sand Springs Campus Statistics
- Tulsa Technology Center - Community College Review
- Tulsa Technology Center