Loading…
← All schools
University of Bridgeport
Bridgeport, CTprivate nonprofitwww.bridgeport.edu/
Acceptance
83%
Avg net price
$27,807
Earnings (10 yr)
$50,323
Graduation rate
41%
Admit rate has ranged 55%–82% over the last 5 years — notably volatile, though the latest figure above (83%) falls outside that window. Source: IPEDS via Urban Institute.
Acceptance & SAT from Common Data Set / IPEDS; net price, earnings & graduation from the U.S. Dept. of Education College Scorecard. Figures lag ~1–2 years — verify with the school.
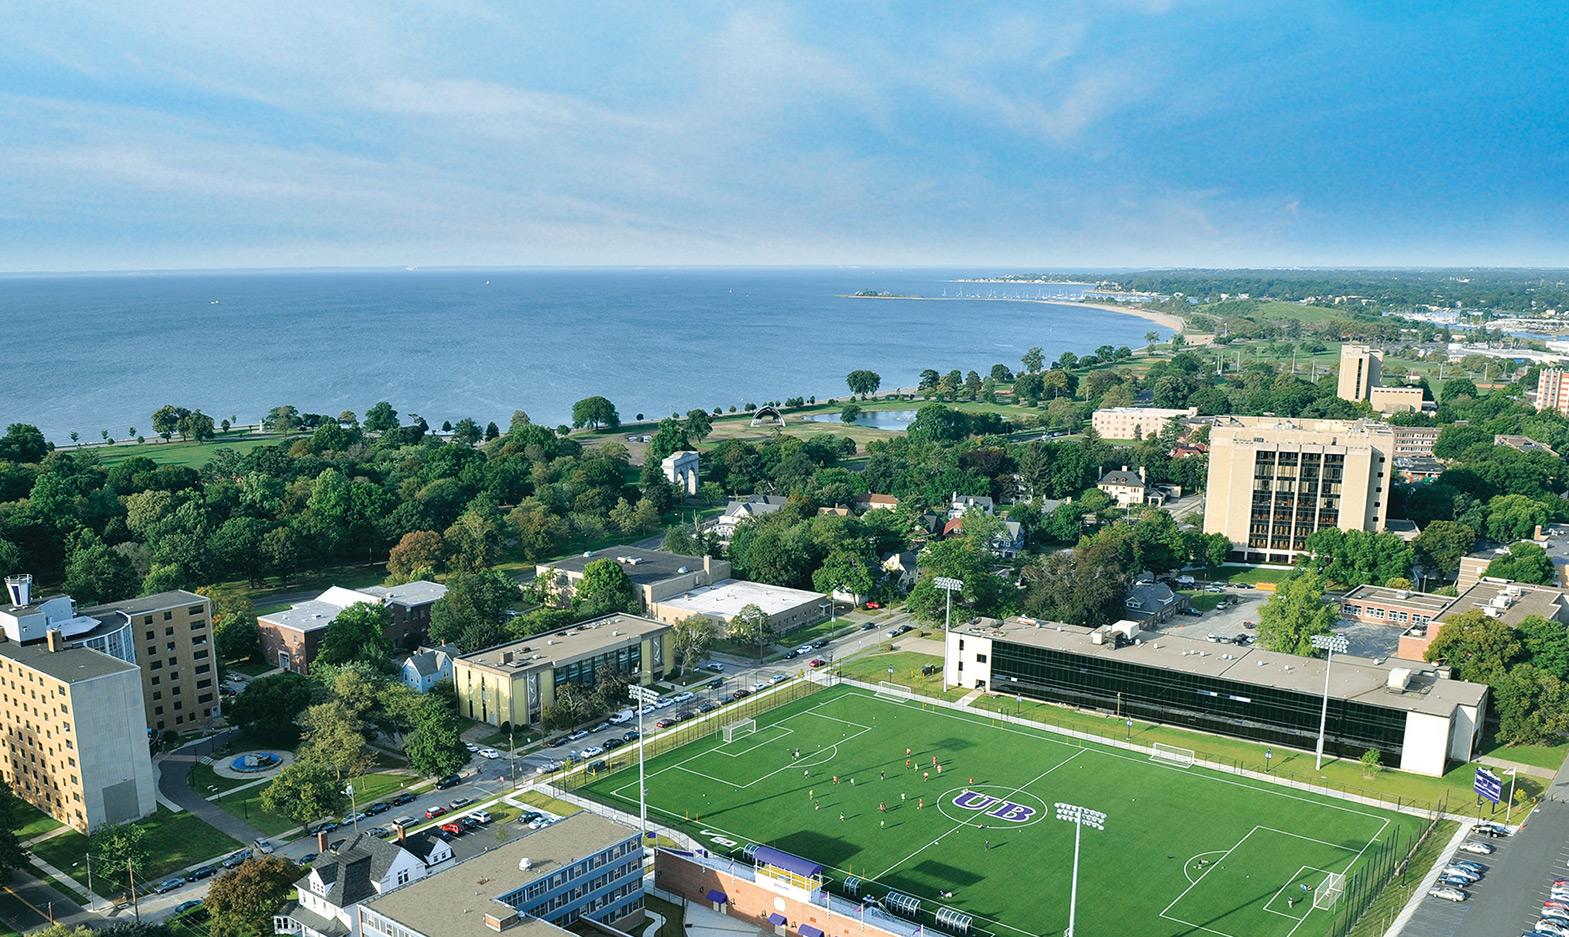
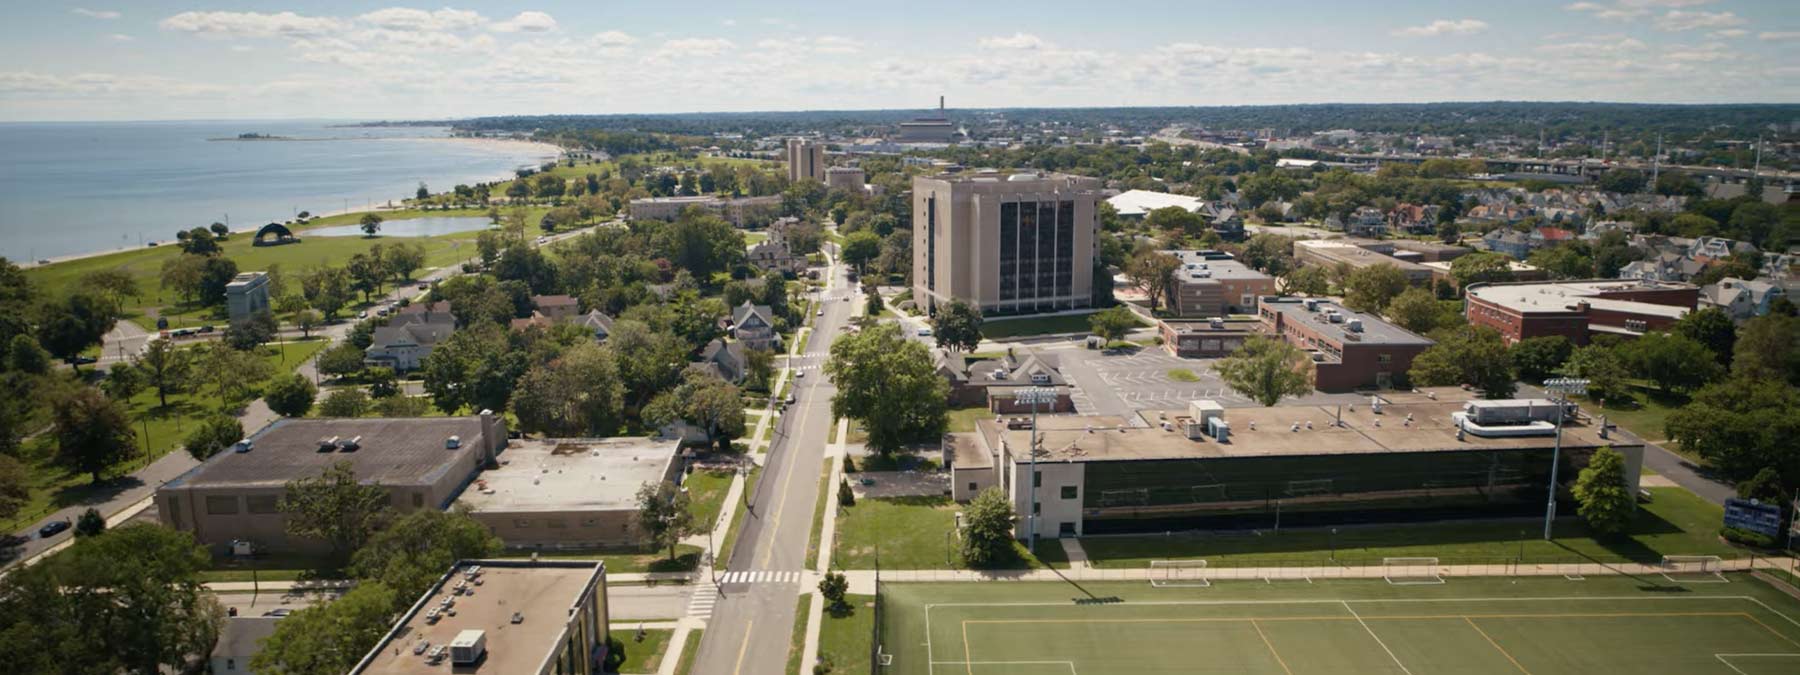
The University of Bridgeport is a private Connecticut institution that operates on a straightforward, career-focused premise: it offers direct admission into practical majors for a predominantly international and diverse student body. With an admissions process that is notably accessible, the university positions itself as a launchpad for first-generation and career-switching students, though its retention and graduation rates signal the challenges some face in navigating its path. Its identity is less about ivy-covered tradition and more about providing a functional, flexible education in fields like business, data analytics, and health sciences within a compact, urban campus.
Admission requirements
Test-optional — scores considered if submitted
Required
- High school transcript
- Grade point average
- TOEFL (non-native English)
Considered (not required)
- Letters of recommendation
- Test scores (SAT/ACT)
Source: IPEDS Admissions survey (2022) via Urban Institute. Covers formal factors only — it does not reflect essays, extracurriculars, or other holistic criteria.
More details
- Undergrad enrollment
- 1,534
- In-state tuition
- $35,760
- Out-of-state tuition
- $35,760
- Graduation Rate
- 41%
- Student-Faculty Ratio
- 16:1
- Median Earnings (10yr)
- $50,323
- First-Year Retention Rate
- 62%
- Regular Decision Deadline
- March 4
Outcomes & value
Outcomes & value
- Median earnings (10 yr)
- $50,323
- Value (earnings ÷ net price)
- 1.8×
- Median debt at graduation
- $25,750
- Graduation rate
- 41%
- First-year retention
- 61%
- Reducing loan balance (3 yr)
- 50%
- Pell (lower-income) share
- 53%
- First-gen share (among federal-aid recipients)
- 42%
Financial health
2.9 / 3.0Meets the federal financial-responsibility standard
U.S. Dept. of Education Financial Responsibility Composite Score (FY2022-23). Scale −1.0 to 3.0; ≥1.5 meets the standard. Reported for private nonprofit & for-profit institutions only — public universities are state-backed and not scored, so this is a stability signal, not a ranking.
Top-earning majors
Median earnings by field of study (highest credential), ~2 years after completion.
- Clinical/Medical Laboratory Science/Research and Allied Professions$63,005
- Dental Support Services and Allied Professions$59,576
- Liberal Arts and Sciences, General Studies and Humanities$47,260
- Criminal Justice and Corrections$39,648
- Human Services, General$37,088
- Psychology, General
Campus & location
Campus safety
- On-campus violent crimes (2024)
- 3
- Per 1,000 students
- 0.79
On-campus criminal offenses classed as violent (murder/non-negligent manslaughter, rape, robbery, aggravated assault) for the most recent reported year. Source: U.S. Dept. of Education Campus Safety and Security (Clery Act). Counts reflect what’s reported to the school, and urban campuses often report more partly due to non-student incidents nearby — read alongside campus size and setting, not as a standalone safety verdict.
Climate
- Pleasant days / yr
- 98
- Summer high
- 80°F
- Winter low
- 29°F
- Annual rain
- 56.1"
- Annual snow
- 21.2"
Pleasant days counts days per year with a mean temperature of 55–75°F, a high at or below 90°F, a low at or above 45°F, and little precipitation — a transparent comfort measure, not a weighting we invented. Computed from Open-Meteo ERA5 daily history (2019–2023).
Deep dive — research, future-scholar output & economic mobility
Research output
- Institutional h-index
- 119
- Scholarly works
- 4,054
Institutional research volume and impact from OpenAlex. The h-index reflects large research universities and will be low for teaching-focused liberal-arts colleges — not a measure of undergraduate quality.
Economic mobility
- Mobility rate
- 2.9%
- Bottom → top quintile
- 17%
- From bottom quintile
- 17%
Mobility rate = the share of students who both start in the bottom household-income quintile and reach the top quintile; bottom → top is that chance conditional on starting at the bottom. Source: Opportunity Insights Mobility Report Cards (Chetty, Friedman, Saez, Turner & Yagan). Reflects 1980–82 birth cohorts, so it’s directional, not current.
Quick answers
- What is the acceptance rate at University of Bridgeport?
- University of Bridgeport's acceptance rate is approximately 83% (Bridgeport, CT), based on the most recent figures we compiled from public and primary sources.
- How much does University of Bridgeport cost?
- At University of Bridgeport, the average net price (after aid) is about $27,807 per year. Actual cost varies with financial aid and residency.
- How many undergraduates attend University of Bridgeport?
- University of Bridgeport enrolls approximately 1,534 undergraduate students.
- Where is University of Bridgeport located?
- University of Bridgeport is located in Bridgeport, CT.
Admissions
The University of Bridgeport's admissions process is defined by its high accessibility. The university accepts students directly into their chosen major or program of study, though undergraduates also have the option to enroll with an undecided major. For the most recent cycle, 9,237 applicants sought admission, with 7,669 receiving an offer, resulting in an of 83%. Of those accepted, 1,570 students enrolled. The middle 50% SAT range for admitted students is reported as 935–1160, with average subsection scores of 485 for Evidence-Based Reading and Writing and 470 for Math. The average ACT Composite score is 20. The university offers both Early Action, a non-binding application process, and Early Decision, a binding option. While specific Early Decision acceptance rates for Bridgeport are not detailed in the provided sources, the policy exists and can provide an admissions advantage. Demonstrated interest—such as campus visits or contacting admissions—is a factor colleges may consider, but the for Bridgeport does not specify its policy among the provided snippets.
Admitted students come from a wide academic range; reported GPA distributions show 19% had a GPA between 3.50–3.74, and 15% between 3.25–3.49. The process is rolling, with a regular admission deadline of March 4.
Compare University of Bridgeport
See colleges similar to University of Bridgeport →Sources
- Fast Facts and Information | University of Bridgeport
- University of Bridgeport Overview - CollegeData
- [PDF] Common Data Set 2021-2022 - Colorado Department of Education
- Common Data Set: Home
- Common Data Set - GradGPT
- Common Data Set - Westminster University
- University of Bridgeport Admissions - BigFuture College Search
- University of Bridgeport Requirements for Admission - PrepScholar
- University of Bridgeport Admissions - US News Best Colleges
- University of Bridgeport - Tuition and Acceptance Rate - Peterson's