Admit rate has ranged 71%–91% over the last 5 years — notably volatile. Source: IPEDS via Urban Institute.
Acceptance & SAT from Common Data Set / IPEDS; net price, earnings & graduation from the U.S. Dept. of Education College Scorecard. Figures lag ~1–2 years — verify with the school.
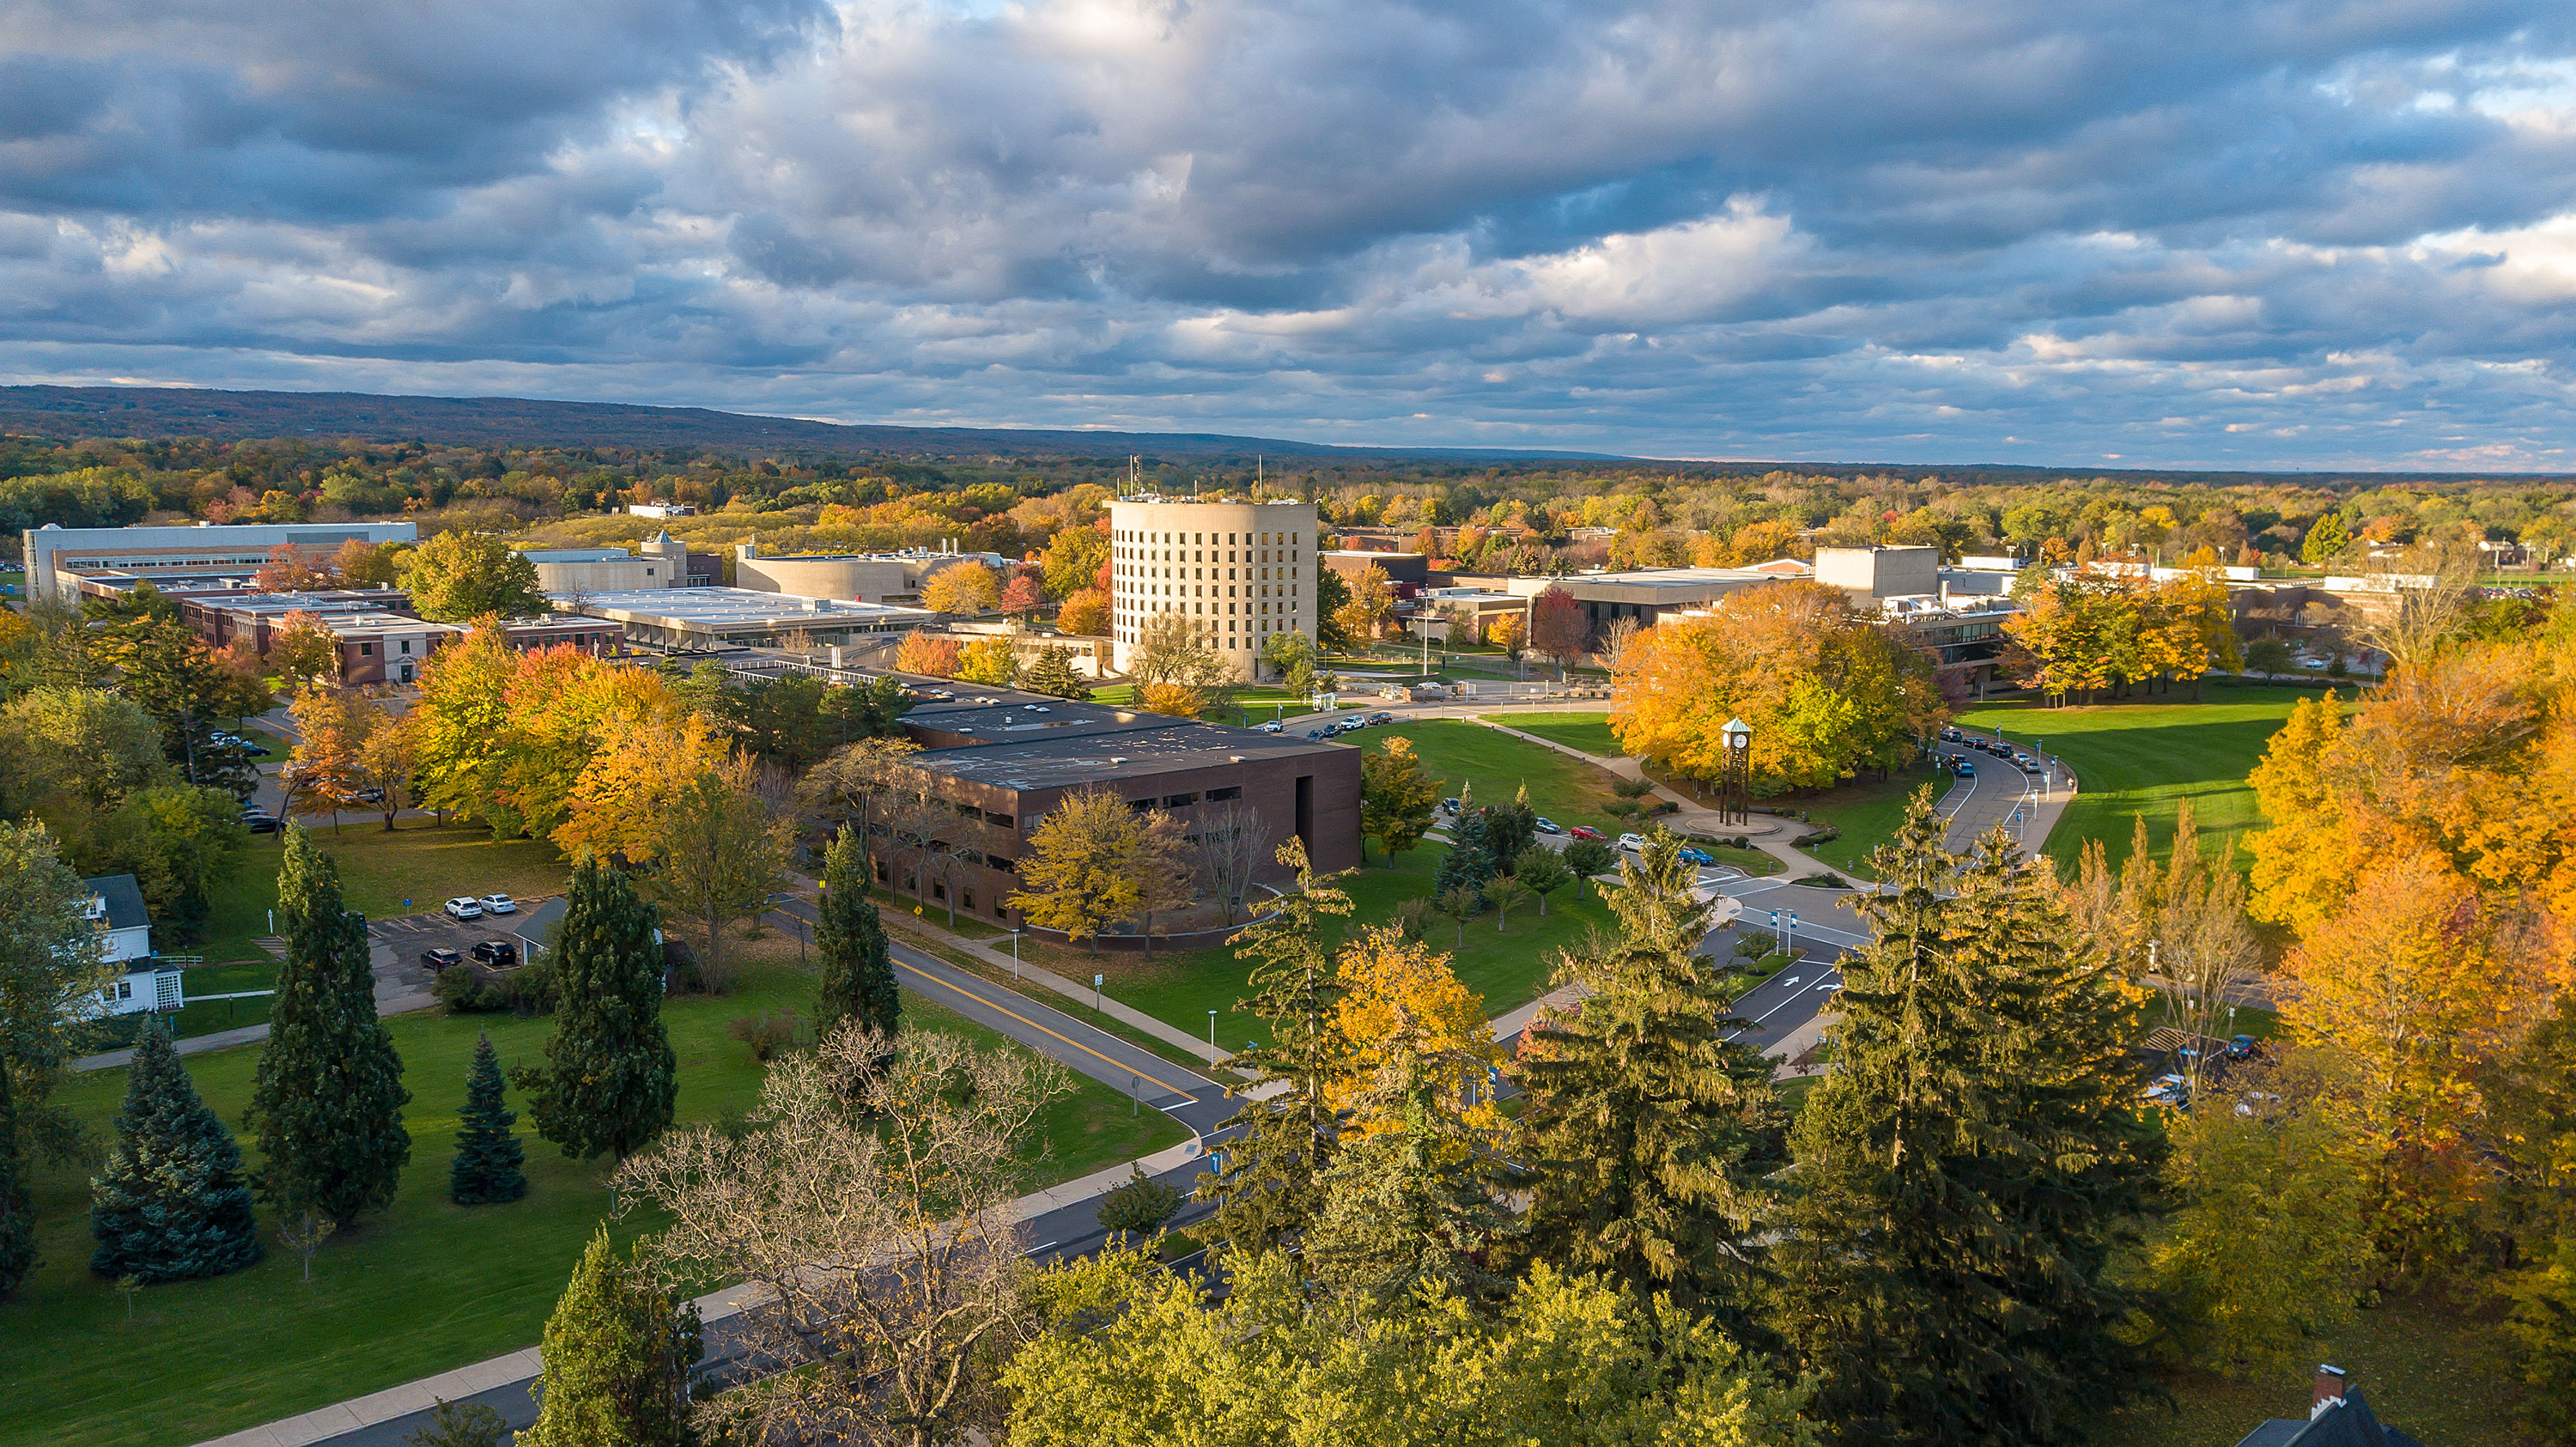
SUNY Fredonia is a public liberal arts university in western New York that has carved out a distinct identity as an affordable, student-centered campus with a surprisingly robust arts scene. It’s a place where a 12:1 student-to-faculty ratio means professors know your name, and where programs in music, theatre, and education punch well above their weight class, even as the institution navigates significant academic cuts to ensure its future. The vibe is collaborative and community-focused, with over half the students living on a campus that actively cultivates traditions and ‘Big Blue Pride.’
Admission requirements
Test-optional — scores considered if submitted
Required
High school transcript
Grade point average
College-prep program
TOEFL (non-native English)
Considered (not required)
Class rank
Letters of recommendation
Test scores (SAT/ACT)
Demonstrated competencies
Source: IPEDS Admissions survey (2022) via Urban Institute. Covers formal factors only — it does not reflect essays, extracurriculars, or other holistic criteria.
More details
Undergrad enrollment
2,755
In-state tuition
$8,831
Out-of-state tuition
$19,771
Top Majors
Education (23%), Visual & Performing Arts (20%)
Graduation Rate
50%
On-Campus Housing
55%
Median Earnings (10yr)
$54,247
Student-to-Faculty Ratio
12:1
Outcomes & value
Outcomes & value
Median earnings (10 yr)
$54,247
Value (earnings ÷ net price)
3.4×
Median debt at graduation
$24,250
Graduation rate
50%
First-year retention
76%
Reducing loan balance (3 yr)
68%
Pell (lower-income) share
39%
First-gen share (among federal-aid recipients)
23%
Top-earning majors
Median earnings by field of study (highest credential), ~2 years after completion.
Clinical/Medical Laboratory Science/Research and Allied Professions$54,015
Computer and Information Sciences, General$49,058
Finance and Financial Management Services$45,207
Information Science/Studies$41,937
Marketing$41,937
Accounting and Related Services
Campus & location
Campus safety
On-campus violent crimes (2024)
3
Per 1,000 students
0.95
On-campus criminal offenses classed as violent (murder/non-negligent manslaughter, rape, robbery, aggravated assault) for the most recent reported year. Source: U.S. Dept. of Education Campus Safety and Security (Clery Act). Counts reflect what’s reported to the school, and urban campuses often report more partly due to non-student incidents nearby — read alongside campus size and setting, not as a standalone safety verdict.
Climate
Pleasant days / yr
101
Summer high
76°F
Winter low
27°F
Annual rain
52"
Annual snow
65.7"
Natural-hazard risk
Relatively Moderate
Pleasant days counts days per year with a mean temperature of 55–75°F, a high at or below 90°F, a low at or above 45°F, and little precipitation — a transparent comfort measure, not a weighting we invented. Computed from Open-Meteo ERA5 daily history (2019–2023). Natural-hazard risk is the county’s composite rating from the FEMA National Risk Index.
Deep dive — research, future-scholar output & economic mobility▾
Economic mobility
Mobility rate
1.2%
Bottom → top quintile
25%
From bottom quintile
5%
Mobility rate = the share of students who both start in the bottom household-income quintile and reach the top quintile; bottom → top is that chance conditional on starting at the bottom. Source: Opportunity Insights Mobility Report Cards (Chetty, Friedman, Saez, Turner & Yagan). Reflects 1980–82 birth cohorts, so it’s directional, not current.
Quick answers
What is the acceptance rate at SUNY at Fredonia?
SUNY at Fredonia's acceptance rate is approximately 78% (Fredonia, NY), based on the most recent figures we compiled from public and primary sources.
What SAT score do you need for SUNY at Fredonia?
Admitted students at SUNY at Fredonia typically score 1160–1370 on the SAT (the middle-50% range). Scores outside this band are still admitted, especially with strong applications.
How much does SUNY at Fredonia cost?
At SUNY at Fredonia, the average net price (after aid) is about $15,897 per year. Actual cost varies with financial aid and residency.
How many undergraduates attend SUNY at Fredonia?
SUNY at Fredonia enrolls approximately 2,755 undergraduate students.
Where is SUNY at Fredonia located?
SUNY at Fredonia is located in Fredonia, NY.
Admissions
Fredonia’s admissions process is accessible, with a 78% reflecting its role as a public institution within the SUNY system. The middle 50% of admitted students present SAT scores between 1160 and 1370, though the university’s own ‘Fast Facts’ page cites a slightly lower middle 50% SAT range of 1070–1260. High school GPA for the middle 50% of admits falls between 85-95 on a 100-point scale. While the is the definitive source for detailed admission factor priorities, the provided snippets do not specify Fredonia’s stance on factors like demonstrated interest or its Early Decision policy. Recent news indicates applications increased by 7% for first-year students, and the acceptance rate dropped by 2 percentage points, suggesting a slight tightening in selectivity.
Fredonia offers over 65 majors, anchored by a 12:1 student-to-faculty ratio that facilitates small classes and personalized attention. The academic profile is dominated by two powerhouse areas: Education (23% of degrees) and Visual and Performing Arts (20%). The university is ‘especially recognized for its strong programs in music, theatre, dance, and education, with highly regarded faculties.’ This isn’t just marketing; it’s the core of the Fredonia experience. Beyond the arts, Business and Psychology each account for 8% of majors. However, this academic landscape is in flux. As part of a ‘multiyear financial sustainability plan,’ Fredonia is cutting 14 degree programs and 7 minors to strengthen enrollment and improve its financial footing. The cuts signal a strategic retrenchment, focusing resources on its most distinctive and viable programs.
Earnings = median of students working ~10 years after entry; debt = median of graduates. Value divides 10-yr earnings by one year’s net price — read it as earnings per dollar of annual cost, not a full lifetime ROI; it favors lower-cost schools. Source: U.S. Dept. of Education College Scorecard. Figures lag ~2 years and reflect all students, not your intended major.
$40,461
Business Administration, Management and Operations$36,560
Criminal Justice and Corrections$33,459
Source: U.S. Dept. of Education College Scorecard (field-of-study earnings). Figures cover graduates who received federal aid and lag ~2 years; not all programs report data.
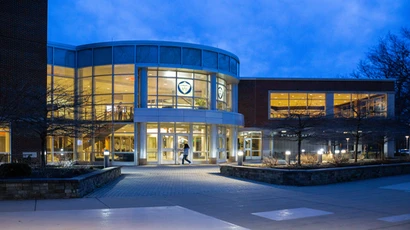
Life at Fredonia is defined by connection and a strong campus culture. The Office of Campus Life explicitly works to ‘encourage connection, involvement, and belonging through student activities, campus traditions, and a vibrant student union.’ A wide range of clubs and organizations exists, with a natural emphasis on the arts reflecting the academic strengths. The residential experience is split: 55% of students live in college-owned, -operated, or -affiliated housing, while 45% live off-campus. The campus actively fosters ‘Big Blue Pride’ through coordinated college traditions designed to build community. While specific traditions aren't named in the provided sources, the institutional commitment to creating a cohesive, involved student body is clear and intentional.
Fredonia promotes strong post-graduate outcomes, with the university claiming 99.1% of graduates are employed or continuing their education. More granularly, the Career Development Office reports that 98% of graduates are employed full-time, and the mean salary range for full-time employed alumni within one year of graduation is $40,000–$49,999. The median earnings ten years after entry are $54,247, which College Ranker notes is 33% above the national college median. The six-year graduation rate is a point of public pride, cited by Money magazine at 64%, which the university notes is ‘well above the national average.’ These figures paint a picture of a university that delivers solid value, particularly for students in its signature fields.
Affordability is a central pillar of Fredonia’s value proposition. The average after grants and scholarships is $15,897. The university provides tools like an interactive Net Price Calculator and publishes cost guides to help families estimate expenses. Financial aid support is emphasized, with one source noting that 95% of first-year students receive grants or scholarships. The provided sources do not specify whether Fredonia has a policy of meeting 100% of demonstrated financial need or a ‘no-loan’ policy for any income bracket. Students and families are directed to the Financial Aid Office and external private loan resources for financing options.
Fredonia stands out for delivering a high-touch, liberal arts experience at a public university price, but its true distinction lies in its artistic heartbeat. It’s not just a school with good arts programs; for a significant portion of its student body, the arts are the program. This creates a campus culture where creative ambition is the norm, not the exception, supported by respected faculties. That culture is nurtured by an intentionally small scale (the 12:1 ratio) and a campus life apparatus dedicated to building tradition and pride. The university is in a consequential moment of transition, making difficult cuts to ensure its sustainability, which signals a focus on preserving its core strengths. For a student seeking an affordable, collaborative environment where they can deeply engage in the arts or education—and be known by their professors—Fredonia offers a compelling and singular option within the SUNY system.
SUNY at Fredonia seal · sourceHomepage of the State University of New York at Fredonia (SUNY Fredonia) · sourceUniversity Commons | Fredonia.edu · sourceSUNY at Fredonia - Profile, Rankings and Data | US News Best Colleges · source