Admit rate has ranged 79%–82% over the last 5 years, though the latest figure above (56%) falls outside that window. Source: IPEDS via Urban Institute.
Acceptance & SAT from Common Data Set / IPEDS; net price, earnings & graduation from the U.S. Dept. of Education College Scorecard. Figures lag ~1–2 years — verify with the school.
Lawrence Technological University is a scrappy, career-focused institution in suburban Detroit that treats a college education like a precision tool: it’s about building practical, market-ready skills, not just theory. With a 10:1 student-faculty ratio and a curriculum laser-focused on engineering, architecture, and business, LTU feels more like a high-tech workshop than a traditional liberal arts campus. Its identity is forged in the pragmatic, industrial spirit of its region, producing graduates who are prized by local employers for their readiness to contribute from day one.
Admission requirements
Test-blind — scores not considered
Required
High school transcript
Grade point average
Demonstrated competencies
TOEFL (non-native English)
Considered (not required)
College-prep program
Source: IPEDS Admissions survey (2022) via Urban Institute. Covers formal factors only — it does not reflect essays, extracurriculars, or other holistic criteria.
More details
Undergrad enrollment
1,668
In-state tuition
$44,760
Out-of-state tuition
$44,760
Graduation Rate
61%
Demonstrated Interest
Not considered
Student-Faculty Ratio
10:1
Financial Aid Need Met
76%
Median Earnings (10yr)
$69,151
Classes Under 20 Students
82%
First-Year Students Receiving Aid
100%
Outcomes & value
Outcomes & value
Median earnings (10 yr)
$69,151
Value (earnings ÷ net price)
2.1×
Median debt at graduation
$27,000
Graduation rate
61%
First-year retention
78%
Reducing loan balance (3 yr)
64%
Pell (lower-income) share
16%
First-gen share (among federal-aid recipients)
22%
Financial health
2.3 / 3.0Meets the federal financial-responsibility standard
U.S. Dept. of Education Financial Responsibility Composite Score (FY2022-23). Scale −1.0 to 3.0; ≥1.5 meets the standard. Reported for private nonprofit & for-profit institutions only — public universities are state-backed and not scored, so this is a stability signal, not a ranking.
Top-earning majors
Median earnings by field of study (highest credential), ~2 years after completion.
Electrical, Electronics, and Communications Engineering$84,653
On-campus criminal offenses classed as violent (murder/non-negligent manslaughter, rape, robbery, aggravated assault) for the most recent reported year. Source: U.S. Dept. of Education Campus Safety and Security (Clery Act). Counts reflect what’s reported to the school, and urban campuses often report more partly due to non-student incidents nearby — read alongside campus size and setting, not as a standalone safety verdict.
Climate
Pleasant days / yr
89
Summer high
81°F
Winter low
23°F
Annual rain
37.4"
Annual snow
30.7"
Natural-hazard risk
Relatively High
Pleasant days counts days per year with a mean temperature of 55–75°F, a high at or below 90°F, a low at or above 45°F, and little precipitation — a transparent comfort measure, not a weighting we invented. Computed from Open-Meteo ERA5 daily history (2019–2023). Natural-hazard risk is the county’s composite rating from the FEMA National Risk Index.
Deep dive — research, future-scholar output & economic mobility▾
Research output
Institutional h-index
82
Scholarly works
2,227
Institutional research volume and impact from OpenAlex. The h-index reflects large research universities and will be low for teaching-focused liberal-arts colleges — not a measure of undergraduate quality.
Economic mobility
Mobility rate
2.4%
Bottom → top quintile
31%
From bottom quintile
8%
Mobility rate = the share of students who both start in the bottom household-income quintile and reach the top quintile; bottom → top is that chance conditional on starting at the bottom. Source: Opportunity Insights Mobility Report Cards (Chetty, Friedman, Saez, Turner & Yagan). Reflects 1980–82 birth cohorts, so it’s directional, not current.
Quick answers
What is the acceptance rate at Lawrence Technological University?
Lawrence Technological University's acceptance rate is approximately 56% (Southfield, MI), based on the most recent figures we compiled from public and primary sources.
How much does Lawrence Technological University cost?
At Lawrence Technological University, the average net price (after aid) is about $32,918 per year. Actual cost varies with financial aid and residency.
How many undergraduates attend Lawrence Technological University?
Lawrence Technological University enrolls approximately 1,668 undergraduate students.
Where is Lawrence Technological University located?
Lawrence Technological University is located in Southfield, MI.
Admissions
LTU operates on a rolling admissions policy, meaning qualified applicants are accepted in the order they apply, and there is no formal Early Decision program. The admissions process is described as 'somewhat selective,' with reported variably across sources, though the university's official provides the definitive framework. The university considers a student's academic record—including GPA, rigor of secondary school record, and class rank—as 'very important' factors. Standardized test scores (SAT/ACT) are considered but are not required for admission or scholarship review, aligning with a policy. Recommendations and the application essay are rated as 'important,' while extracurricular activities, talent/ability, and character/personal qualities are also considered. Notably, the level of an applicant's interest—or 'demonstrated interest'—is listed as 'not considered' in the admissions evaluation, meaning campus visits or engagement with admissions staff do not formally impact decisions. The admissions office can be reached at 248.204.3160 or [email protected].
Earnings = median of students working ~10 years after entry; debt = median of graduates. Value divides 10-yr earnings by one year’s net price — read it as earnings per dollar of annual cost, not a full lifetime ROI; it favors lower-cost schools. Source: U.S. Dept. of Education College Scorecard. Figures lag ~2 years and reflect all students, not your intended major.
$57,318
Civil Engineering$53,358
Design and Applied Arts$48,432
Source: U.S. Dept. of Education College Scorecard (field-of-study earnings). Figures cover graduates who received federal aid and lag ~2 years; not all programs report data.
The academic experience at LTU is defined by intense focus and close mentorship. With a student-faculty ratio of 10:1, 82% of classes have fewer than 20 students, ensuring individual attention. The curriculum is unabashedly centered on technology and applied professions; the most popular majors are Mechanical Engineering, Architecture, Electrical Engineering, and Civil Engineering. The university prides itself on being 'curiosity driven' and 'technologically savvy,' aiming to produce graduates 'inspired by purpose.' This practical orientation is recognized externally: LTU is featured in "The Best 390 Colleges" by the Princeton Review, which specifically praises its small class sizes, individual faculty attention, and 'many opportunities for internships and co-op' experiences. The academic structure includes associate, bachelor's, master's, and doctoral degrees, with a strong emphasis on connecting classroom learning directly to professional practice.
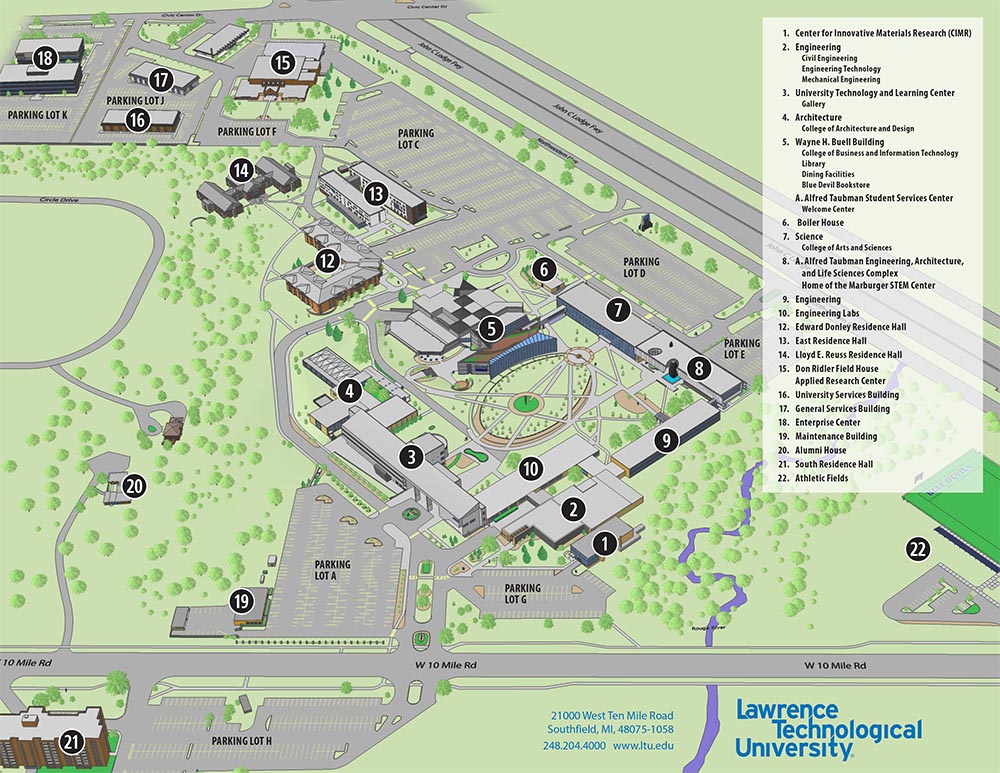
Life on LTU's 120-acre campus in Southfield is tightly knit and activity-rich, though a slim majority of students (51%) live off-campus. About 50% live in college-owned or affiliated housing. The campus itself features modern academic buildings, computer facilities, a library, dining commons, and a full-service recreational center. Athletics are a significant part of the culture, with over 30 teams and 700 student-athletes who come from every academic program. Beyond sports, there are more than 40 student organizations, ranging from cultural groups to professional societies and special-interest clubs. The university actively cultivates a 'supportive community' for first-year students, encouraging them to engage with campus culture from day one. Students often describe the environment as welcoming, citing the close relationships formed with faculty who 'truly care.' It's a campus where the 'subtle sounds' of collaborative, project-based work often define the daily rhythm.
The LTU degree is engineered for a payoff. The university boasts that its graduates 'earned the highest average starting salaries in Michigan three consecutive years (2021, 2022 and 2023) of $66,000+ per year.' Furthermore, over 95% of graduates are reported to be employed or in graduate school within six months of commencement. Early career earnings are strong, with one source noting graduates earn about $11,000 more than might be expected for their field. Specific program outcomes are notable; for example, Mechanical Engineering graduates command 'substantial income.' The university's economic impact report underscores this direct pipeline to the workforce, a key selling point in the industrial heartland of Michigan.
Attending LTU requires a significant investment, but the university works to offset costs through financial aid. Notably, 100% of full-time beginning undergraduates receive some form of grant or scholarship aid. The university reports meeting 76% of its students' financial aid need, with need-based self-help aid comprising federal loans and work-study. All students must be enrolled at least half-time (6 credits for undergraduates) to receive aid. Prospective students are directed to use the university's Calculator for a personalized estimate. The financial aid office ([email protected], 248.204.2280) is the primary resource for navigating these options.
Lawrence Tech stands out for its unwavering, almost purist, commitment to applied technical education. It doesn't try to be everything to everyone; it's a specialist. Its excellence is measured not in Ivy League-style prestige, but in the concrete metrics prized by its regional economy: starting salaries, employment rates, and industry readiness. The combination of microscopic class sizes—82% under 20 students—with a curriculum laser-focused on engineering, architecture, and tech creates an environment akin to a professional apprenticeship. This is amplified by its location in Metro Detroit, placing students at the doorstep of a vast network of automotive, manufacturing, and design firms. The result is a university with a distinct personality: pragmatic, focused, and confident in the value of its graduates' skills. It's a place where the 'why' of your education is answered every day in the lab, the studio, and the co-op, culminating in a diploma that functions as a reliable ticket to the upper tier of the Midwestern workforce.
Lawrence Technological University seal · sourceCampus Map - Lawrence Technological University · sourceLawrence Technological University (Lawrence Tech) - Profile, Rankings and Data | US News Best Colleges · sourceThe LTU Experience · source