Admit rate has ranged 4%–6% over the last 5 years. Source: IPEDS via Urban Institute.
Acceptance & SAT from Common Data Set / IPEDS; net price, earnings & graduation from the U.S. Dept. of Education College Scorecard. Figures lag ~1–2 years — verify with the school.
Princeton University isn't just an Ivy; it's a cloistered, Gothic-accented universe that combines the intense focus of a liberal arts college with the firepower of a global research titan. Its singular character is defined by a fiercely intellectual yet surprisingly intimate undergraduate experience, anchored by a residential college system and the unique social ecosystem of the eating clubs. With a financial aid policy that makes it accessible to a far broader economic range than its elite reputation suggests, Princeton is a place where world-changing research and deep, personal mentorship are not mutually exclusive.
Admission requirements
Test-optional — scores considered if submitted
Required
High school transcript
Letters of recommendation
TOEFL (non-native English)
Considered (not required)
Grade point average
Class rank
Test scores (SAT/ACT)
College-prep program
Demonstrated competencies
Source: IPEDS Admissions survey (2022) via Urban Institute. Covers formal factors only — it does not reflect essays, extracurriculars, or other holistic criteria.
Key deadlines (2026-2027)
Restrictive Early Action — Single-Choice Early Action
November 1, 2026
Regular Decision — Regular Decision
January 1, 2027
Financial Aid — Financial Aid Application Deadline
February 1, 2027
More details
Undergrad enrollment
5,709
In-state tuition
$62,688
Out-of-state tuition
$62,688
No-Loan Policy
Yes, for all qualifying students
Graduation Rate
98%
Meets Full Need
Yes
First-Year Retention
98%
Demonstrated Interest
Not considered
Financial Aid Coverage
Most families with income <$250k pay no tuition
Median Earnings (10yr)
$110,066
Outcomes & value
Outcomes & value
Median earnings (10 yr)
$110,066
Value (earnings ÷ net price)
18.0×
Median debt at graduation
$10,320
Graduation rate
98%
First-year retention
98%
Reducing loan balance (3 yr)
86%
Pell (lower-income) share
19%
First-gen share (among federal-aid recipients)
28%
Financial health
2.2 / 3.0Meets the federal financial-responsibility standard
U.S. Dept. of Education Financial Responsibility Composite Score (FY2022-23). Scale −1.0 to 3.0; ≥1.5 meets the standard. Reported for private nonprofit & for-profit institutions only — public universities are state-backed and not scored, so this is a stability signal, not a ranking.
Top-earning majors
Median earnings by field of study (highest credential), ~2 years after completion.
Computer Engineering$103,078
Economics$103,078
Public Policy Analysis$62,012
English Language and Literature, General$47,260
Political Science and Government$47,260
Sociology$44,942
History
Applicants here also applied to
The schools that most often appear alongside Princeton on applicants’ lists, from our self-reported outcomes corpus.
Co-application frequency from self-reported results — directional peer discovery, not a recommendation.
Campus & location
Campus safety
On-campus violent crimes (2024)
10
Per 1,000 students
1.11
On-campus criminal offenses classed as violent (murder/non-negligent manslaughter, rape, robbery, aggravated assault) for the most recent reported year. Source: U.S. Dept. of Education Campus Safety and Security (Clery Act). Counts reflect what’s reported to the school, and urban campuses often report more partly due to non-student incidents nearby — read alongside campus size and setting, not as a standalone safety verdict.
Climate
Pleasant days / yr
89
Summer high
85°F
Winter low
29°F
Annual rain
51.4"
Annual snow
16.9"
Natural-hazard risk
Relatively High
Pleasant days counts days per year with a mean temperature of 55–75°F, a high at or below 90°F, a low at or above 45°F, and little precipitation — a transparent comfort measure, not a weighting we invented. Computed from Open-Meteo ERA5 daily history (2019–2023). Natural-hazard risk is the county’s composite rating from the FEMA National Risk Index.
Deep dive — research, future-scholar output & economic mobility▾
Research output
Institutional h-index
1,542
Scholarly works
211,765
Institutional research volume and impact from OpenAlex. The h-index reflects large research universities and will be low for teaching-focused liberal-arts colleges — not a measure of undergraduate quality.
Share of this school’s graduates who go on to earn research doctorates (2010–20), by national rank and per-capita yield (NSF institutional-yield ratio). A signal of a research-oriented student culture — not a causal promise, since it partly reflects who enrolls. Only top producers appear. Source: NSF NCSES, Baccalaureate Origins of U.S. Research Doctorate Recipients.
Economic mobility
Quick answers
What is the acceptance rate at Princeton University?
Princeton University's acceptance rate is approximately 5% (Princeton, NJ), based on the most recent figures we compiled from public and primary sources.
What SAT score do you need for Princeton University?
Admitted students at Princeton University typically score 1510–1580 on the SAT (the middle-50% range). Scores outside this band are still admitted, especially with strong applications.
How much does Princeton University cost?
At Princeton University, the average net price (after aid) is about $6,128 per year. Actual cost varies with financial aid and residency.
How many undergraduates attend Princeton University?
Princeton University enrolls approximately 5,709 undergraduate students.
Where is Princeton University located?
Princeton University is located in Princeton, NJ.
Admissions
Gaining admission to Princeton is an exercise in statistical improbability, a process that has grown increasingly selective. The university's Single-Choice Early Action (SCEA) program offers a significant advantage, with historically running at 14-16%, roughly four times the Regular Decision rate. For the Class of 2024, the Early Action acceptance rate was 15.8%. Notably, the university does not consider an applicant's level of demonstrated interest—campus visits, emails, etc.—in its admissions decisions. The admitted student profile is predictably stellar, with typical SAT middle 50% scores in the 1510-1570 range and ACT scores between 34 and 35. The most recent enrolled class of 1,408 students was 51% female and 49% male, with 16.7% being college students. Applicants can contact the office at (609) 258-3060 or [email protected].
Earnings = median of students working ~10 years after entry; debt = median of graduates. Value divides 10-yr earnings by one year’s net price — read it as earnings per dollar of annual cost, not a full lifetime ROI; it favors lower-cost schools. Source: U.S. Dept. of Education College Scorecard. Figures lag ~2 years and reflect all students, not your intended major.
$43,798
Biochemistry, Biophysics and Molecular Biology$37,568
Source: U.S. Dept. of Education College Scorecard (field-of-study earnings). Figures cover graduates who received federal aid and lag ~2 years; not all programs report data.
Mobility rate = the share of students who both start in the bottom household-income quintile and reach the top quintile; bottom → top is that chance conditional on starting at the bottom. Source: Opportunity Insights Mobility Report Cards (Chetty, Friedman, Saez, Turner & Yagan). Reflects 1980–82 birth cohorts, so it’s directional, not current.
Princeton’s academic identity is its defining paradox: it is a major research university that functions with the close-knit, mentoring-focused ethos of a liberal arts college. This unique combination is its greatest strength. The curriculum maintains a traditionally strong focus in literature, literary theory, and philosophy, while also developing significant new strength in media studies and the visual arts. Graduate programs showcase areas of deep expertise, including evolutionary ecology, behavioral ecology, theoretical ecology, and population, community, and ecosystem ecology. The university's commitment to academic rigor and innovation is widely recognized, making it a top choice for students seeking a world-class learning environment where undergraduate access to faculty and resources is unparalleled.
Life at Princeton revolves around its distinctive residential and social structures, creating a self-contained and deeply engaged community. The campus life office aims to create an environment that inspires students to realize their full potential through self-discovery and connection to community, offering academic, athletic, social, cultural, personal development, and community service opportunities. The social scene for undergraduates is famously centered around the eating clubs on Prospect Avenue, which serve as the hub for much of the university's social life, including parties. Students describe the community as diverse and inclusive, with individuals from various nationalities, ethnic backgrounds, and economic statuses. The overall vibe, as noted by admitted students, is one where people genuinely love the university—its people, campus, and unique culture—though the social scene is heavily influenced by the eating club system, which is known for a strong drinking and hook-up culture.
A Princeton degree is a launchpad to exceptional long-term success, underscored by the highest graduation rate in the country. The university reports a 98.4% graduation rate, the highest nationally. This near-universal graduation success translates into powerful career and advanced study outcomes. According to the 2024 Undergraduate Outcomes Report, a significant majority of graduates pursue advanced degrees; for instance, 73% of alumni from one cohort had completed an advanced degree within 18 years of entry, with 9% completing Law degrees and 8% completing Medical degrees. Financially, the payoff is substantial, with graduates earning a median annual salary that significantly outpaces the national average for college graduates.
Princeton’s financial aid program is arguably its most revolutionary feature, fundamentally reshaping who can afford an Ivy League education. The university meets 100% of a student's demonstrated financial need with grant aid that does not need to be repaid. In 2001, Princeton made history as the first university in the country to eliminate loans from its financial aid packages, a 'no-loan' policy it maintains today. This commitment is so extensive that most undergraduate families with incomes up to $250,000 will pay no tuition. For the 2025-26 academic year, 70.5% of full-time undergraduates received financial aid. The result is that Princeton often costs less than a state university, with an average that makes this elite education accessible based on talent, not family wealth.
Princeton stands apart for its potent, almost anachronistic synthesis of scale and intimacy. It offers the vast resources, Nobel-winning faculty, and groundbreaking research of a global university, yet channels them into an undergraduate experience modeled on a small, tutorial-based liberal arts college. This is not a place where undergraduates are an afterthought to graduate programs; they are the central mission. The unique social architecture of the eating clubs creates a cohesive, if sometimes insular, campus culture unlike any other Ivy. Most consequentially, Princeton's pioneering and staggeringly generous financial aid model—the first to go no-loan—transforms its gates from exclusive to genuinely equitable. It's a university that invests not just in its prestige, but in the idea that the most powerful education should be available to the most talented students, full stop.
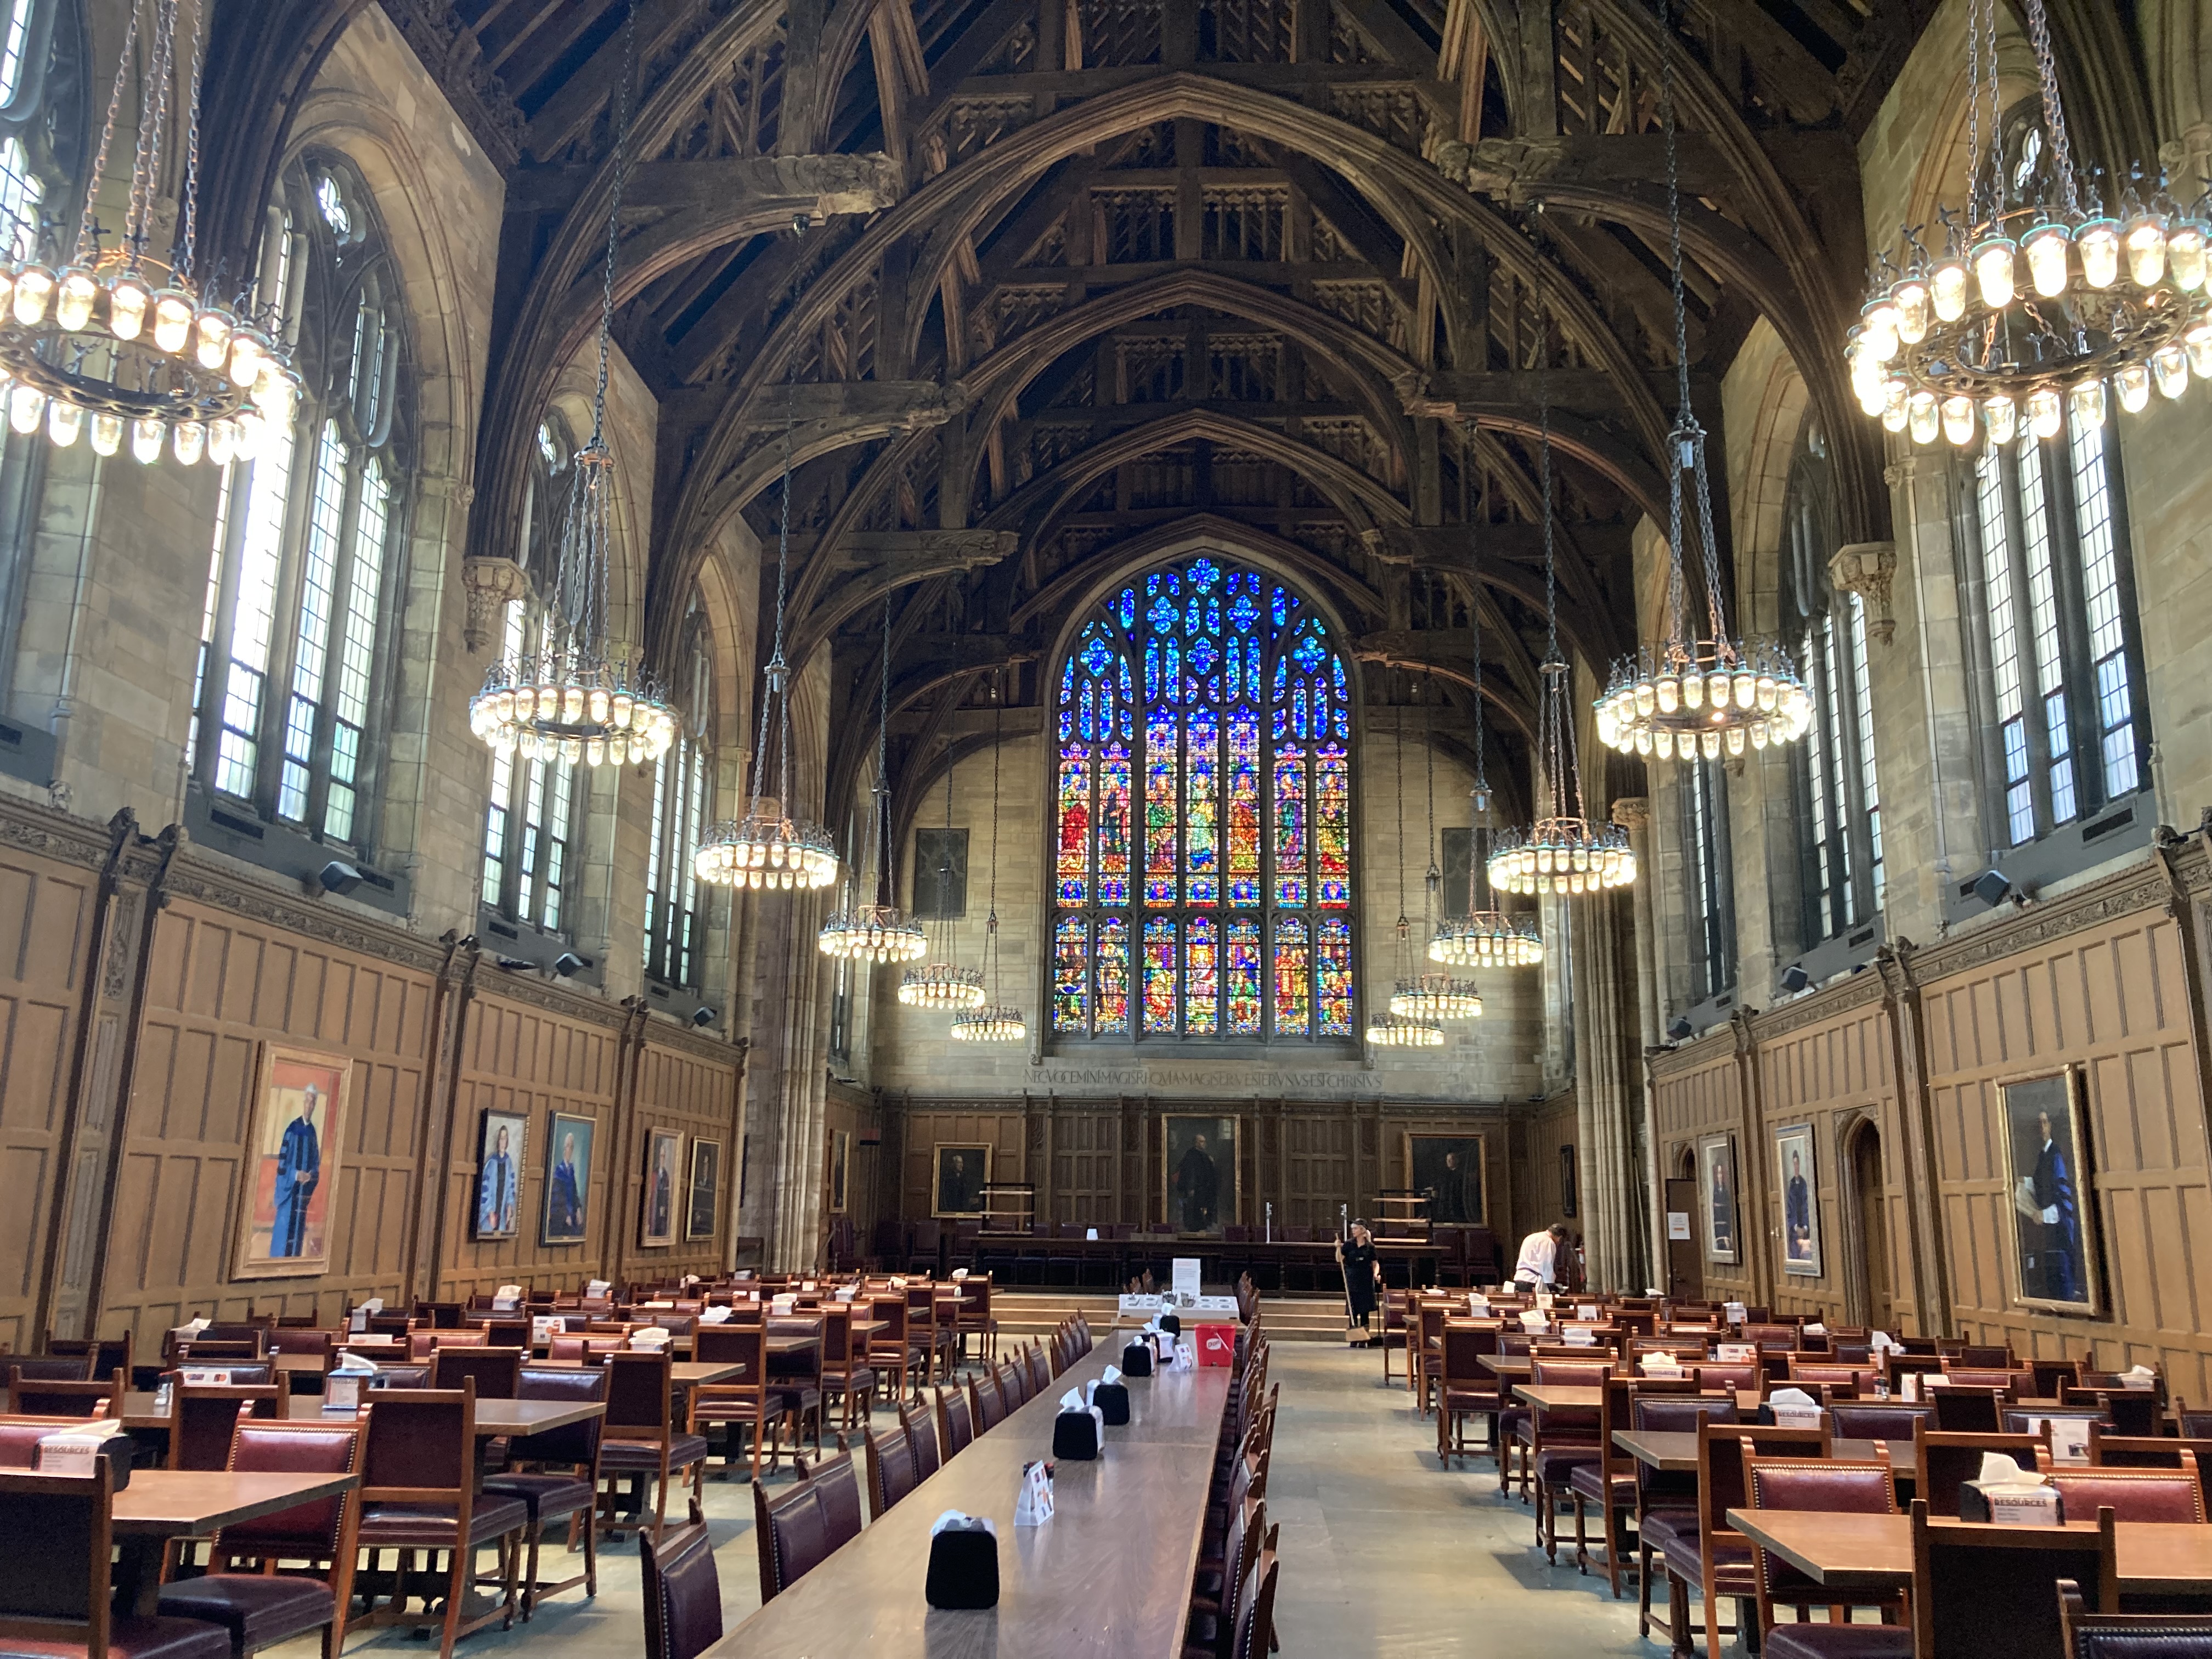
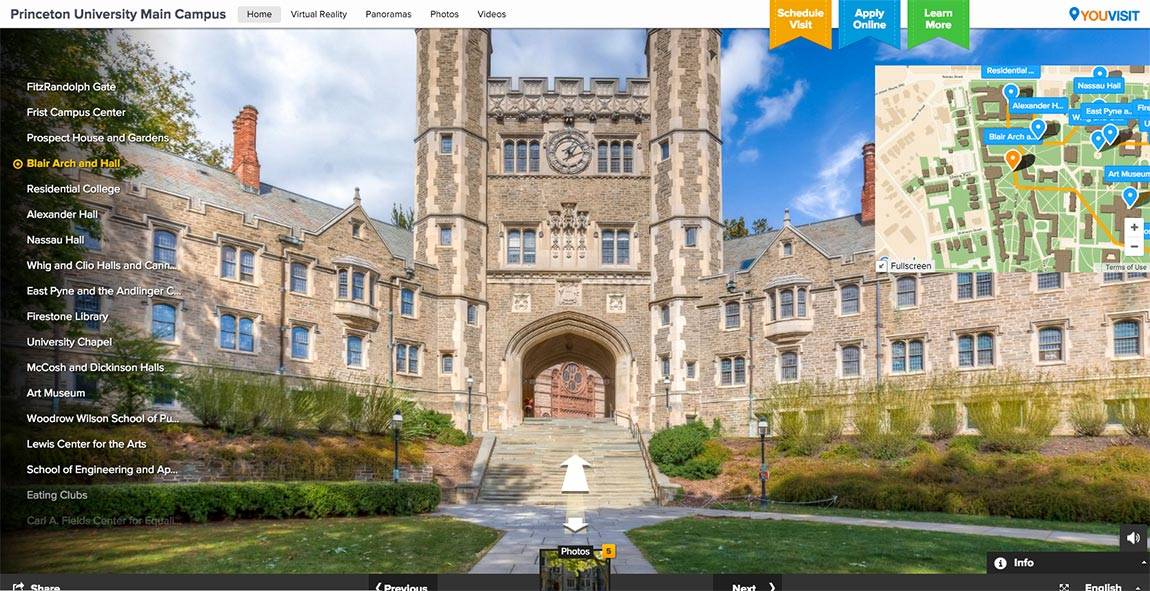
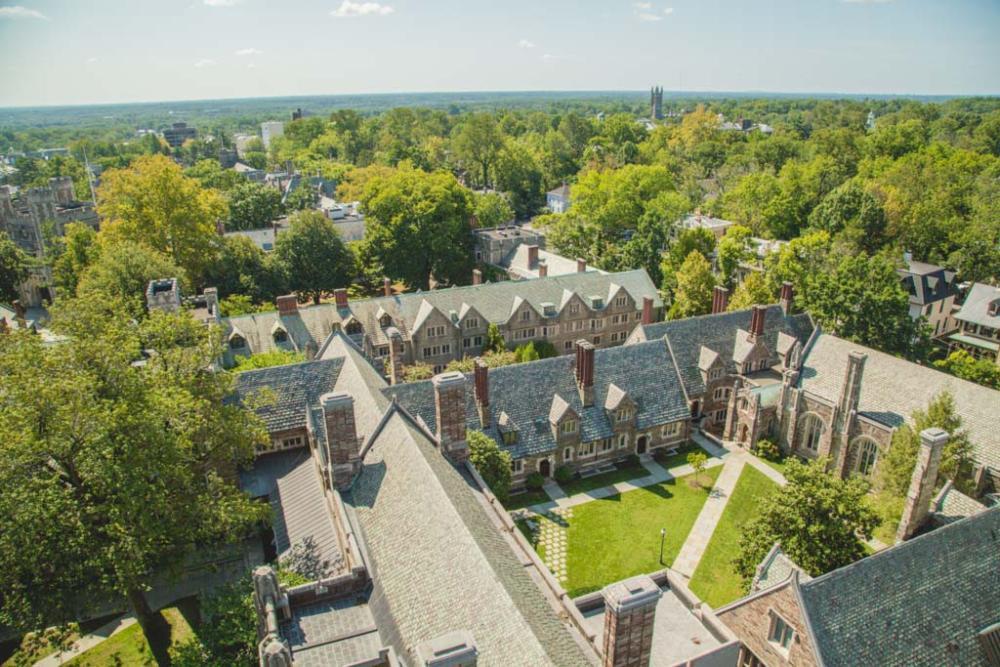
Princeton University seal · sourceVirtual tour lets viewers around the globe explore Princeton's campus · sourceExploring The Graduate College | Princeton Admission · sourceVisit Us | Princeton Admission · source