Admit rate has ranged 3%–5% over the last 5 years. Source: IPEDS via Urban Institute.
Acceptance & SAT from Common Data Set / IPEDS; net price, earnings & graduation from the U.S. Dept. of Education College Scorecard. Figures lag ~1–2 years — verify with the school.
Harvard University is less a college than a global institution, a centuries-old engine of prestige where the world's most ambitious students converge. The experience is defined by an almost monastic dedication to intellectual rigor within a surprisingly intimate residential House system, juxtaposed against the relentless pressure of its own mythology. It offers unparalleled access—to Nobel laureates, a legendary endowment, and a network that opens doors everywhere—but demands steeliness to navigate its high-stakes atmosphere, all for a net price averaging $19,066 and a 98% chance of crossing the stage.
Admission requirements
Test scores required
Required
High school transcript
Letters of recommendation
Test scores (SAT/ACT)
Considered (not required)
Grade point average
Class rank
College-prep program
Demonstrated competencies
TOEFL (non-native English)
Source: IPEDS Admissions survey (2022) via Urban Institute. Covers formal factors only — it does not reflect essays, extracurriculars, or other holistic criteria.
Key deadlines (2026-2027)
Restrictive Early Action — Restrictive Early Action
November 1, 2026
Regular Decision — Regular Decision
January 1, 2027
Financial Aid — Financial Aid Application Priority Date
February 1, 2027
More details
Undergrad enrollment
7,601
Testing policy
Required
In-state tuition
$61,676
Out-of-state tuition
$61,676
No-Loan Policy
Yes, incomes < $200k
Graduation Rate
98%
Meets Full Need
Yes
First-Year Retention
98%
Demonstrated Interest
Not Considered
Median Earnings (10yr)
$101,817
Outcomes & value
Outcomes & value
Median earnings (10 yr)
$101,817
Value (earnings ÷ net price)
5.3×
Median debt at graduation
$14,000
Graduation rate
98%
First-year retention
98%
Reducing loan balance (3 yr)
71%
Pell (lower-income) share
16%
First-gen share (among federal-aid recipients)
26%
Financial health
2.8 / 3.0Meets the federal financial-responsibility standard
U.S. Dept. of Education Financial Responsibility Composite Score (FY2022-23). Scale −1.0 to 3.0; ≥1.5 meets the standard. Reported for private nonprofit & for-profit institutions only — public universities are state-backed and not scored, so this is a stability signal, not a ranking.
Top-earning majors
Median earnings by field of study (highest credential), ~2 years after completion.
Computer Science$128,737
Statistics$128,716
Applied Mathematics$90,856
Economics$78,971
Research and Experimental Psychology$57,318
Political Science and Government$57,017
Sociology
Applicants here also applied to
The schools that most often appear alongside Harvard on applicants’ lists, from our self-reported outcomes corpus.
Co-application frequency from self-reported results — directional peer discovery, not a recommendation.
Campus & location
Campus safety
On-campus violent crimes (2024)
18
Per 1,000 students
0.62
On-campus criminal offenses classed as violent (murder/non-negligent manslaughter, rape, robbery, aggravated assault) for the most recent reported year. Source: U.S. Dept. of Education Campus Safety and Security (Clery Act). Counts reflect what’s reported to the school, and urban campuses often report more partly due to non-student incidents nearby — read alongside campus size and setting, not as a standalone safety verdict.
Climate
Pleasant days / yr
91
Summer high
81°F
Winter low
25°F
Annual rain
49"
Annual snow
31.4"
Natural-hazard risk
Relatively High
Pleasant days counts days per year with a mean temperature of 55–75°F, a high at or below 90°F, a low at or above 45°F, and little precipitation — a transparent comfort measure, not a weighting we invented. Computed from Open-Meteo ERA5 daily history (2019–2023). Natural-hazard risk is the county’s composite rating from the FEMA National Risk Index.
Deep dive — research, future-scholar output & economic mobility▾
Research output
Institutional h-index
2,764
Scholarly works
703,326
Institutional research volume and impact from OpenAlex. The h-index reflects large research universities and will be low for teaching-focused liberal-arts colleges — not a measure of undergraduate quality.
Share of this school’s graduates who go on to earn research doctorates (2010–20), by national rank and per-capita yield (NSF institutional-yield ratio). A signal of a research-oriented student culture — not a causal promise, since it partly reflects who enrolls. Only top producers appear. Source: NSF NCSES, Baccalaureate Origins of U.S. Research Doctorate Recipients.
Economic mobility
Quick answers
What is the acceptance rate at Harvard University?
Harvard University's acceptance rate is approximately 4% (Cambridge, MA), based on the most recent figures we compiled from public and primary sources.
What SAT score do you need for Harvard University?
Admitted students at Harvard University typically score 1510–1580 on the SAT (the middle-50% range). Scores outside this band are still admitted, especially with strong applications.
How much does Harvard University cost?
At Harvard University, the average net price (after aid) is about $19,066 per year. Actual cost varies with financial aid and residency.
How many undergraduates attend Harvard University?
Harvard University enrolls approximately 7,601 undergraduate students.
Is Harvard University test-optional?
Harvard University requires SAT or ACT scores for admission.
Where is Harvard University located?
Harvard University is located in Cambridge, MA.
Admissions
Gaining admission to Harvard College is an exercise in statistical improbability, a process so selective that its published of 4% masks an even more daunting reality for Regular Decision applicants. The university's own Fact Book shows an admit rate of 4.2% for the Class of 2029, with over 47,893 applicants for about 2,003 spots. Analysis suggests the Restrictive Early Action (REA) round offers a significant relative advantage, with estimated acceptance rates around 8-9%, compared to a Regular Decision rate that plunges to approximately 2.5-2.8%. The rate—the percentage of admitted students who enroll—is astonishingly high at 83.6%, indicating that nearly everyone who gets in says yes.
The admitted cohort is academically superlative. While Harvard reinstated standardized testing requirements, the middle 50% SAT range for admitted students is typically 1520-1580, with an ACT range of 34-36. The average weighted GPA is a near-perfect 4.22. According to the , the most important factors in admissions are the academic rigor of the secondary school record, class rank, GPA, standardized test scores, and the application essay. Notably, demonstrated interest is "Not Considered" in Harvard's admissions process—visits, interviews, and contact with admissions officers are not tracked for favor.
The process is intensely holistic, seeking students who are not just academically flawless but who show exceptional talent, character, and leadership. The sheer volume of applications—which peaked above 54,000 before the pause—means that even perfect scores and grades are merely the price of entry into a vast pool of qualified candidates from which a tiny fraction is chosen.
Earnings = median of students working ~10 years after entry; debt = median of graduates. Value divides 10-yr earnings by one year’s net price — read it as earnings per dollar of annual cost, not a full lifetime ROI; it favors lower-cost schools. Source: U.S. Dept. of Education College Scorecard. Figures lag ~2 years and reflect all students, not your intended major.
$56,641
Social Sciences, General$52,107
Source: U.S. Dept. of Education College Scorecard (field-of-study earnings). Figures cover graduates who received federal aid and lag ~2 years; not all programs report data.
Mobility rate = the share of students who both start in the bottom household-income quintile and reach the top quintile; bottom → top is that chance conditional on starting at the bottom. Source: Opportunity Insights Mobility Report Cards (Chetty, Friedman, Saez, Turner & Yagan). Reflects 1980–82 birth cohorts, so it’s directional, not current.
Harvard's academic landscape is defined by staggering breadth and depth across its 13 Schools, but the undergraduate experience at Harvard College is surprisingly personalized. The curriculum emphasizes intellectual exploration, with small classes and a vast array of fascinating course topics across a diverse field of subjects. There is no single "Harvard major," but the most popular concentrations include Social Sciences, Biology/Biological Sciences, Mathematics, Computer Science, and History.
The core of the experience is access: access to Pulitzer and Nobel Prize-winning professors who also teach undergraduates, access to cutting-edge research opportunities from the first year, and access to resources fueled by the largest academic endowment in the world. The academic culture is intensely rigorous but not cutthroat; the focus is on deep engagement rather than mere grade competition. Students describe the quality of education and the engagement of professors as exceptional, fostering significant intellectual growth. The system is designed to be flexible, allowing for personalized degree programs and encouraging interdisciplinary study. The underlying principle is that intelligence and talent are not bound by discipline, and the university's is built on empowering students to gain knowledge and make an impact.
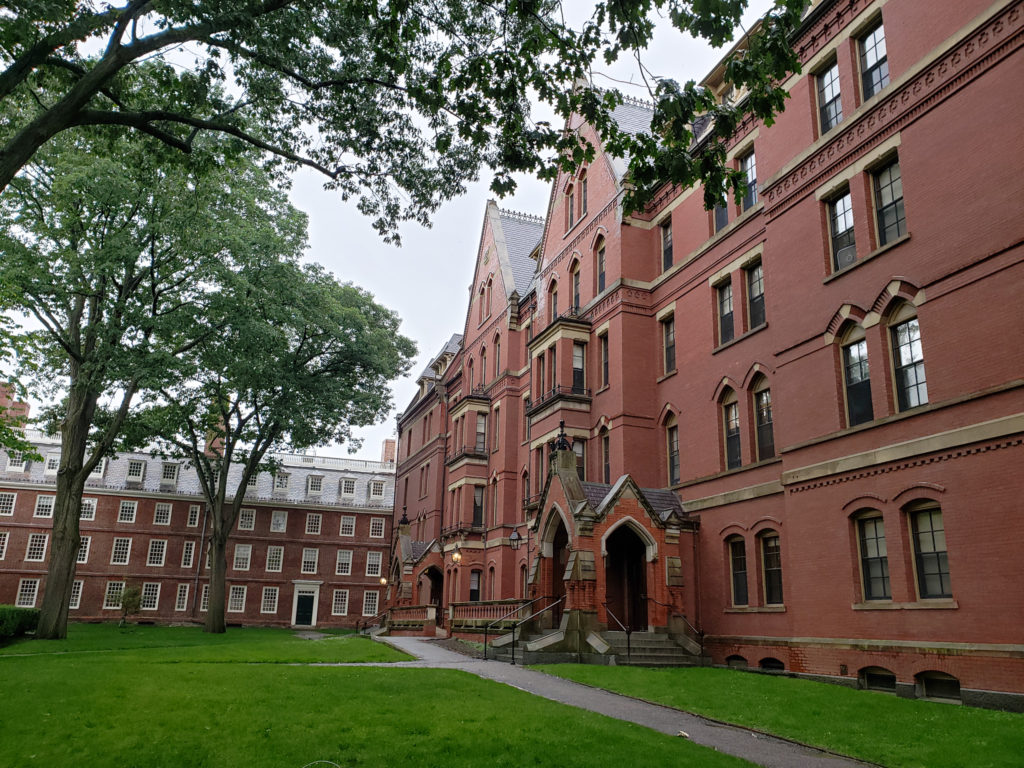
Life at Harvard is a study in contrasts: it's a small liberal arts college embedded within a massive, world-famous research university. The defining feature is the residential House system. After their freshman year in central dormitories, students are randomly sorted into one of twelve historic Houses, each with its own dining hall, library, intramural teams, and tight-knit community. This system fosters a strong sense of belonging and is renowned for creating lifelong friendships and networks.
The overall vibe, as described by students, is not one of cutthroat competition but of a vibrant, supportive community where students feel encouraged by professors, House advisers, friends, and teammates. The culture is one of mutual respect and belonging, though the pressure of being surrounded by so many high-achievers is a constant backdrop. Traditions are a big part of the glue, with spring concerts, festivals, and performances that allow students to engage with varied art forms.
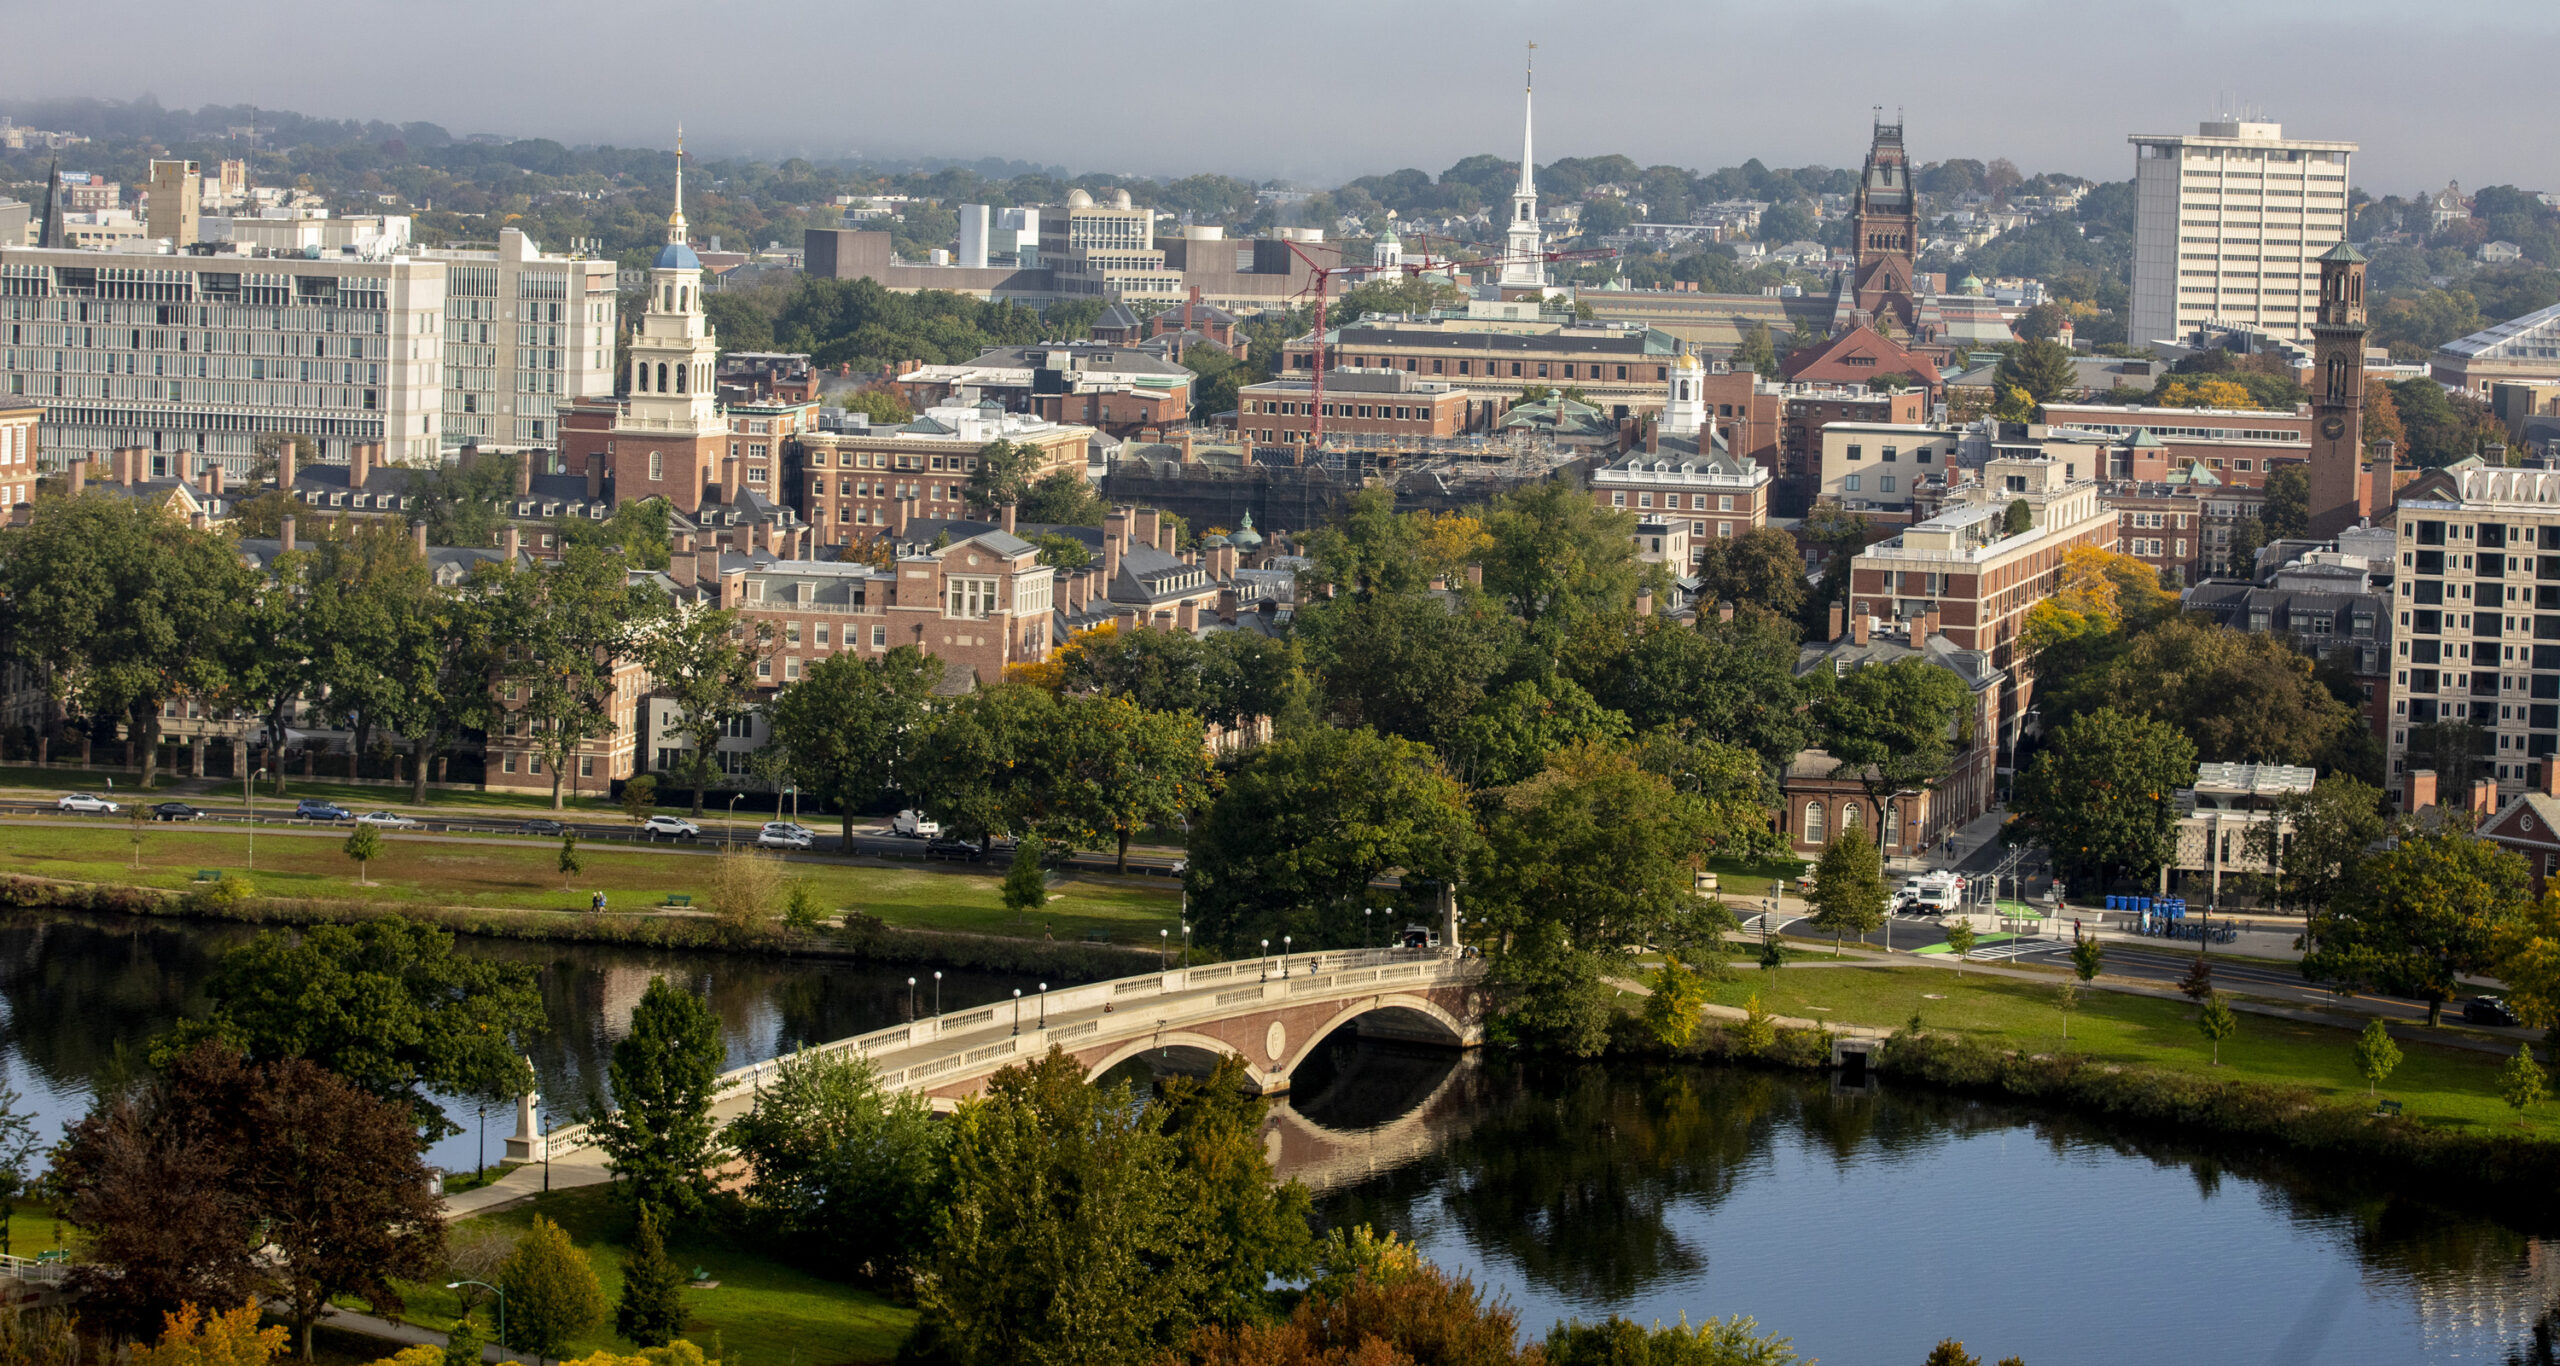
Located in Cambridge, just across the river from Boston, the campus offers the quintessential New England college town experience blended with all the cultural and professional opportunities of a major city. The student body is incredibly diverse in background and interest, united more by a driven curiosity than any single personality type. It's a place where everyone is intensely good at something, and the collective energy is one of purposeful activity.
A Harvard degree is less a certificate of completion than a passport. The outcomes data paints a picture of near-universal success. The graduation rate is an elite 98%, meaning virtually every student who starts finishes. More telling is what happens next.
According to a survey of the graduating Class of 2025, about 17% were heading directly to graduate or professional school. For those entering the workforce, the financial prospects are immediate and substantial: more than half of seniors reported they would earn $70,000 or more right out of school, with 24% entering finance and 18% entering technology—sectors where many will rake in six-figure starting salaries. The median earnings ten years after entry are exceptionally high, reflecting the degree's long-term value. The network—the Harvard alumni community—is perhaps the most valuable asset, offering unparalleled access and influence across every professional field globally.
Harvard's financial aid policy is as formidable as its admissions selectivity, fundamentally built on the principle that cost should not be a barrier for talented students. The university meets 100% of demonstrated financial need for all admitted students and does so with a no-loan policy. This means aid packages are composed entirely of grants and work-study, not loans that must be repaid.
The policy is exceptionally generous for middle-income families. For families with annual incomes up to $200,000, financial aid significantly reduces the cost, with typical contributions ranging from 0-10% of income. The most publicized provision is that families with incomes at or below $100,000 pay nothing—tuition, room, and board are fully covered by Harvard grant aid. The average after aid is low compared to the sticker price, making Harvard more affordable than many public universities for a large segment of its student body. The university encourages all families to use its Net Price Calculator to estimate their actual cost, which is often startlingly lower than expectations.
Harvard stands apart not merely for its age, wealth, or fame, but for the unique ecosystem it has cultivated. It is a place where scale and intimacy coexist: a global research powerhouse with a collegiate heart in the House system. Its admissions process is arguably the most scrutinized and selective on earth, yet it deliberately ignores "demonstrated interest," signaling a confidence that its appeal needs no cultivation. Its financial aid policy is among the most aggressive in higher education, actively using its immense endowment to socioeconomically diversify a student body that would otherwise be accessible only to the wealthy.
Ultimately, Harvard's distinctiveness lies in its dual identity. It is both a symbol—the ultimate shorthand for academic excellence and elite achievement—and a living, breathing community of fiercely curious individuals. It offers the resources of a giant institution with the community feel of a small college, wrapped in traditions that span centuries. The pressure of its name is real, but so is the profound sense of opportunity: the chance to learn from leading thinkers, to tackle world-scale problems as an undergraduate, and to join a network that confers a unique form of agency. It's not for everyone, but for those who thrive there, it is an experience without parallel.
Harvard University seal · sourceCampus - Harvard University · sourceTake A Harvard Campus Tour on Your Visit to Boston - Forever Lost In Travel · sourceHarvard University Photo Tour · source

:max_bytes(150000):strip_icc()/Lowell_House_Harvard_aerial-ee0dc42e7b024f9aa5eee7945d426490.jpg)