Admit rate has ranged 6%–9% over the last 5 years. Source: IPEDS via Urban Institute.
Acceptance & SAT from Common Data Set / IPEDS; net price, earnings & graduation from the U.S. Dept. of Education College Scorecard. Figures lag ~1–2 years — verify with the school.
The University of Pennsylvania is an Ivy League powerhouse defined by its pragmatic, pre-professional energy and its location in the heart of Philadelphia. It's where Benjamin Franklin's founding ethos of 'useful' education manifests in a fiercely competitive, work-hard-play-hard culture across four distinct undergraduate schools, with Wharton's gravitational pull shaping the campus's ambitious, finance-oriented vibe. This is not a cloistered liberal arts college; it's a high-stakes launchpad where intellectual rigor meets real-world hustle.
Admission requirements
Test-optional — scores considered if submitted
Required
High school transcript
Grade point average
Letters of recommendation
Considered (not required)
Class rank
Test scores (SAT/ACT)
College-prep program
Demonstrated competencies
TOEFL (non-native English)
Source: IPEDS Admissions survey (2022) via Urban Institute. Covers formal factors only — it does not reflect essays, extracurriculars, or other holistic criteria.
Key deadlines (2026-2027)
Early Decision — Early Decision
November 1, 2026
Regular Decision — Regular Decision
January 5, 2027
Financial Aid — CSS Profile & FAFSA Priority Deadline for Regular Decision Applicants
January 5, 2027
More details
Undergrad enrollment
10,650
In-state tuition
$68,686
Out-of-state tuition
$68,686
No-Loan Policy
Yes, for all demonstrated need
Graduation Rate
97%
Meets Full Need
Yes
Demonstrated Interest
Considered
Student-Faculty Ratio
8:1
Median Earnings (10yr)
$111,371
Median Starting Salary (2023)
$100,000
First-Destination Full-Time Job Rate
76% (within 6 months)
Outcomes & value
Outcomes & value
Median earnings (10 yr)
$111,371
Value (earnings ÷ net price)
3.9×
Median debt at graduation
$15,715
Graduation rate
97%
First-year retention
99%
Reducing loan balance (3 yr)
84%
Pell (lower-income) share
17%
First-gen share (among federal-aid recipients)
19%
Financial health
3.0 / 3.0Meets the federal financial-responsibility standard
U.S. Dept. of Education Financial Responsibility Composite Score (FY2022-23). Scale −1.0 to 3.0; ≥1.5 meets the standard. Reported for private nonprofit & for-profit institutions only — public universities are state-backed and not scored, so this is a stability signal, not a ranking.
Top-earning majors
Median earnings by field of study (highest credential), ~2 years after completion.
Computer and Information Sciences, General$138,932
Computer Science$125,015
Finance and Financial Management Services$122,725
Systems Engineering$101,964
International/Globalization Studies$84,653
Biomedical/Medical Engineering$82,440
Applicants here also applied to
The schools that most often appear alongside Penn on applicants’ lists, from our self-reported outcomes corpus.
Co-application frequency from self-reported results — directional peer discovery, not a recommendation.
Campus & location
Campus safety
On-campus violent crimes (2024)
17
Per 1,000 students
0.60
On-campus criminal offenses classed as violent (murder/non-negligent manslaughter, rape, robbery, aggravated assault) for the most recent reported year. Source: U.S. Dept. of Education Campus Safety and Security (Clery Act). Counts reflect what’s reported to the school, and urban campuses often report more partly due to non-student incidents nearby — read alongside campus size and setting, not as a standalone safety verdict.
Climate
Pleasant days / yr
89
Summer high
85°F
Winter low
30°F
Annual rain
49.8"
Annual snow
12.8"
Natural-hazard risk
Very High
Pleasant days counts days per year with a mean temperature of 55–75°F, a high at or below 90°F, a low at or above 45°F, and little precipitation — a transparent comfort measure, not a weighting we invented. Computed from Open-Meteo ERA5 daily history (2019–2023). Natural-hazard risk is the county’s composite rating from the FEMA National Risk Index.
Deep dive — research, future-scholar output & economic mobility▾
Research output
Institutional h-index
1,742
Scholarly works
380,126
Institutional research volume and impact from OpenAlex. The h-index reflects large research universities and will be low for teaching-focused liberal-arts colleges — not a measure of undergraduate quality.
Future-scholar output
Science & engineering PhDstop 31 nationally
Humanities & social-science PhDstop 25 nationally
Share of this school’s graduates who go on to earn research doctorates (2010–20), by national rank and per-capita yield (NSF institutional-yield ratio). A signal of a research-oriented student culture — not a causal promise, since it partly reflects who enrolls. Only top producers appear. Source: NSF NCSES, Baccalaureate Origins of U.S. Research Doctorate Recipients.
Economic mobility
Mobility rate
Quick answers
What is the acceptance rate at University of Pennsylvania?
University of Pennsylvania's acceptance rate is approximately 5% (Philadelphia, PA), based on the most recent figures we compiled from public and primary sources.
What SAT score do you need for University of Pennsylvania?
Admitted students at University of Pennsylvania typically score 1510–1570 on the SAT (the middle-50% range). Scores outside this band are still admitted, especially with strong applications.
How much does University of Pennsylvania cost?
At University of Pennsylvania, the average net price (after aid) is about $28,699 per year. Actual cost varies with financial aid and residency.
How many undergraduates attend University of Pennsylvania?
University of Pennsylvania enrolls approximately 10,650 undergraduate students.
Where is University of Pennsylvania located?
University of Pennsylvania is located in Philadelphia, PA.
Admissions
Gaining admission to Penn is a feat of academic dominance and strategic positioning. The university is extremely selective, with an overall of 5%. The academic profile of admitted students is staggering: 95% of those admitted for Fall 2025 came from the top 10 percent of their high school class, and the average unweighted GPA is 3.9. The middle 50% SAT score range is exceptionally high, with 83% of admitted students submitting scores between 1500 and 1600; the ACT composite middle 50% is 34–36. The university offers both Early Decision and Regular Decision cycles, with a significant admissions advantage for ED applicants. For recent classes, the Early Decision acceptance rate has been estimated at roughly 14.2%, compared to the single-digit overall rate. Penn's indicates that demonstrated interest is considered in the admissions process. The rate—the percentage of admitted students who enroll—is a critical metric of Penn's desirability, though the exact figure from the latest class is not explicitly stated in the provided sources. Applicants must navigate a that heavily weighs academic factors like rigor of secondary school record, class rank, GPA, and standardized test scores, alongside essays, recommendations, and extracurricular activities.
Earnings = median of students working ~10 years after entry; debt = median of graduates. Value divides 10-yr earnings by one year’s net price — read it as earnings per dollar of annual cost, not a full lifetime ROI; it favors lower-cost schools. Source: U.S. Dept. of Education College Scorecard. Figures lag ~2 years and reflect all students, not your intended major.
Mechanical Engineering$80,858
Economics$77,087
Source: U.S. Dept. of Education College Scorecard (field-of-study earnings). Figures cover graduates who received federal aid and lag ~2 years; not all programs report data.
Mobility rate = the share of students who both start in the bottom household-income quintile and reach the top quintile; bottom → top is that chance conditional on starting at the bottom. Source: Opportunity Insights Mobility Report Cards (Chetty, Friedman, Saez, Turner & Yagan). Reflects 1980–82 birth cohorts, so it’s directional, not current.
Penn's academic structure is built around four distinct undergraduate schools: the College of Arts & Sciences, the School of Engineering and Applied Science, the School of Nursing, and the Wharton School. This multi-school model allows for deep specialization but also encourages interdisciplinary study through coordinated dual-degree and accelerated programs. The student-faculty ratio is an intimate 8:1, and 58.8% of classes have fewer than 20 students, facilitating close interaction with faculty. The intellectual culture is often described as intensely pre-professional and pragmatic, a direct of Benjamin Franklin's founding vision for 'useful' education. Wharton's presence as a top-tier undergraduate business school permeates the campus, attracting students focused on finance, consulting, and entrepreneurship. However, this is balanced by strengths in the liberal arts, engineering, and nursing. Students praise the vast array of majors and the ability to integrate courses and ideas across disciplines, but also note the competitive, high-pressure environment where a 'work-hard-play-hard' mentality prevails. The curriculum requires a combination of school-specific requirements, electives, and a major, pushing students to be both focused and intellectually agile.
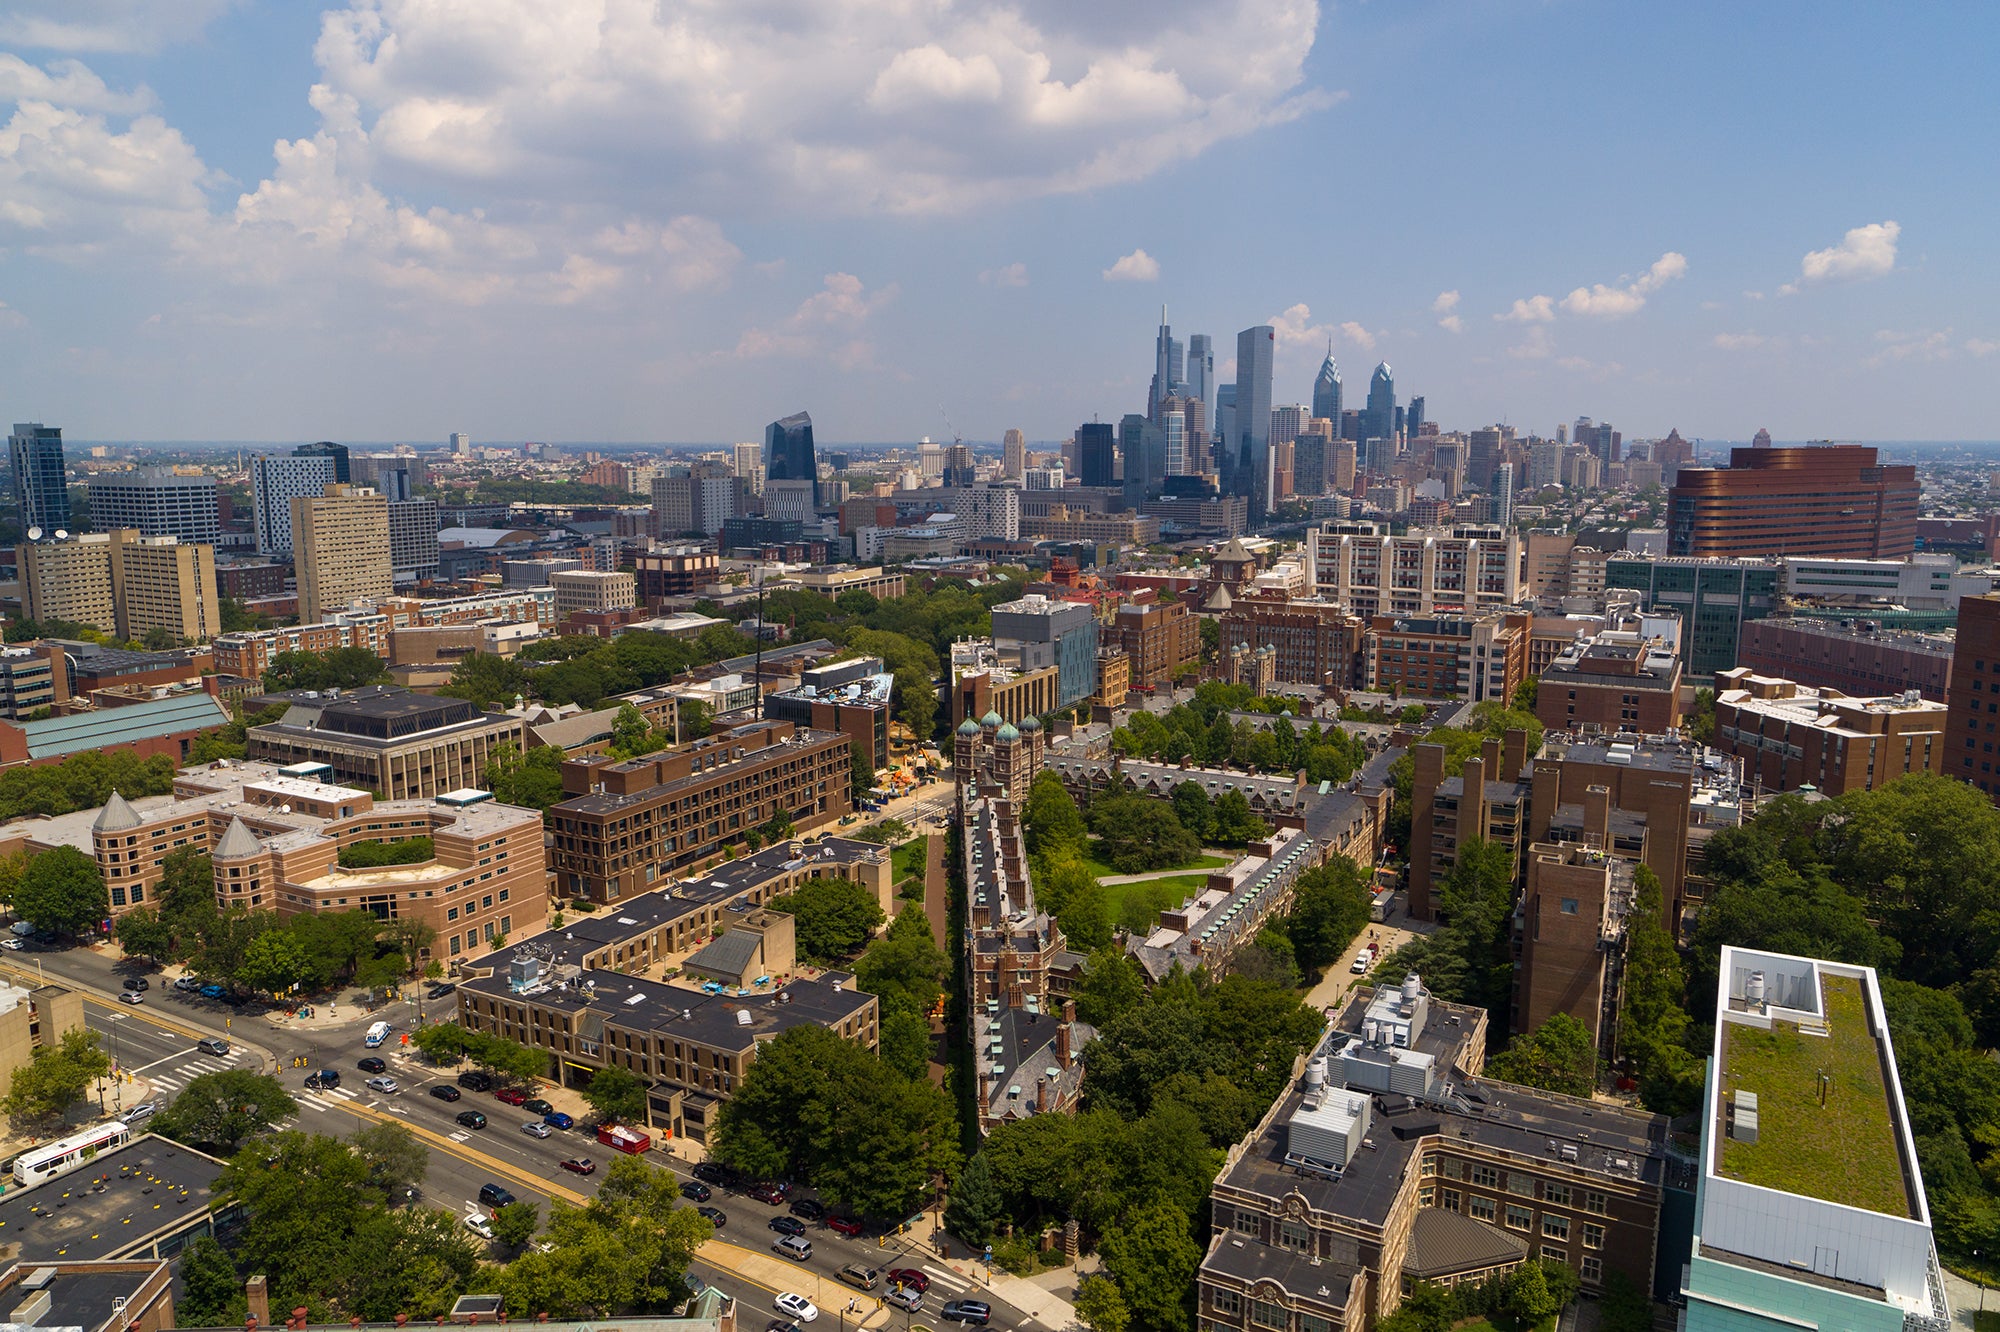
Life at Penn is a high-octane blend of rigorous academics and vibrant, self-directed social activity, all set within the dynamic backdrop of West Philadelphia. The campus is integrated into the city, offering students immediate access to urban culture, internships, and restaurants. The student culture is frequently characterized as work-hard-play-hard, where intense academic pressure is counterbalanced by an active social scene; some even label it a 'great party school.' Beyond the classroom and social events, student life is defined by a massive ecosystem of clubs and activities. The university supports a diverse community through its six Cultural Resource Centers (CRCs), which are dedicated to enriching the campus through academic engagement, cultural celebration, and creating spaces where students feel welcomed and supported. These centers are pivotal in shaping community and belonging for many students. The surrounding area provides endless exploration, though the urban setting comes with the typical considerations of city life. The overall vibe is one of driven, ambitious students constantly juggling commitments, seeking both professional advancement and meaningful social connections.
A Penn degree is a powerful economic engine, translating into exceptional career launch and earning potential. The first-year retention rate is exceptionally high, and the six-year graduation rate is 97%. Post-graduation outcomes are a major point of institutional pride. For the Class of 2023, the median starting salary for graduates was $100,000. Within six months of graduating, 76% of students had secured full-time employment. Career paths are heavily skewed toward high-finance and consulting, though the data shows a recent, slight decline in the share of graduates entering those fields. The university's Career Services collects robust first-destination data, though survey response rates can vary (e.g., 54% for the Class of 2025). The long-term financial payoff is substantial, with the median salary for Penn graduates reaching over $124,000 just four years after completing their degree. These outcomes underscore Penn's reputation as a direct pipeline to elite, high-compensation professions.
Penn's sticker price is steep, but the university has made a significant commitment to affordability through a robust, no-loan financial aid policy. The cornerstone of this effort is The Quaker Commitment, which guarantees that the university will meet 100% of an admitted student's demonstrated financial need with grant-based aid, eliminating loans from the financial aid package. This policy is designed to enable students to graduate debt-free. The university has recently expanded this aid to target middle-income families more aggressively, increasing scholarship amounts for those households. Families are encouraged to use tools like Penn's Calculator and the MyinTuition estimator to get a personalized ballpark figure of their net cost. The average net price after aid—the cost after grants and scholarships are applied—reflects this substantial institutional investment in making Penn accessible. It's important to note that the aid package is based on the university's assessment of demonstrated need, and it applies a need-based methodology where the value of a family's primary home is not considered in the calculation.
Penn distinguishes itself in the Ivy League through its unique, applied ethos. While its peers often exude an aura of cloistered, theoretical scholarship, Penn thrives on a culture of practical ambition. This is the Ivy League with a spreadsheet open—a place where Franklin's founding charge for 'useful' education is alive in the relentless hum of career-focused activity. The presence of Wharton as a fully integrated undergraduate business school creates a gravitational pull toward finance and entrepreneurship that is unmatched by any other top-tier university, coloring the campus vibe with a distinctive, competitive hustle. Yet, this pre-professional drive exists within a framework of genuine interdisciplinary opportunity, from nursing and engineering to the liberal arts, all supported by a remarkably low student-faculty ratio. The combination of this intense, high-reward academic culture with a vibrant, self-directed social scene in a major American city creates an environment that is both exhilarating and demanding. Penn doesn't just educate students; it accelerates them, packaging Ivy League prestige with a tangible, often immediate, return on investment.
University of Pennsylvania seal · sourceUniversity of Pennsylvania — Landmark Review | Condé Nast Traveler · sourceCampus life | Penn LPS · sourceCollege Hall | University of Pennsylvania Facilities and Real Estate Services · source