Admit rate has ranged 26%–37% over the last 5 years — notably volatile. Source: IPEDS via Urban Institute.
Acceptance & SAT from Common Data Set / IPEDS; net price, earnings & graduation from the U.S. Dept. of Education College Scorecard. Figures lag ~1–2 years — verify with the school.
The University of California, Santa Barbara is a public research university where world-class science and engineering programs collide with a legendary, sun-drenched beach-town social scene. It’s a place of intense academic rigor—particularly in physics, engineering, and the environmental sciences—wrapped in a uniquely Californian package of surfboards, bikes, and a collaborative, outdoorsy student culture. Don't be fooled by the postcard setting; this is a serious academic powerhouse with a competitive admissions process and strong career outcomes.
Admission requirements
Test-blind — scores not considered
Required
High school transcript
Grade point average
College-prep program
TOEFL (non-native English)
Source: IPEDS Admissions survey (2022) via Urban Institute. Covers formal factors only — it does not reflect essays, extracurriculars, or other holistic criteria.
More details
Undergrad enrollment
23,113
In-state tuition
$16,414
Out-of-state tuition
$50,614
No-Loan Policy
No
Graduation Rate
83%
Meets Full Need
No
Demonstrated Interest
Not considered
Median Earnings (10yr)
$74,915
Outcomes & value
Outcomes & value
Median earnings (10 yr)
$74,915
Value (earnings ÷ net price)
4.7×
Median debt at graduation
$13,993
Graduation rate
83%
First-year retention
93%
Reducing loan balance (3 yr)
75%
Pell (lower-income) share
28%
First-gen share (among federal-aid recipients)
42%
Top-earning majors
Median earnings by field of study (highest credential), ~2 years after completion.
Computer Science$81,554
Computer Engineering$76,773
Electrical, Electronics, and Communications Engineering$72,134
Economics$60,790
Mechanical Engineering$60,452
Applied Mathematics$59,536
Chemical Engineering
Applicants here also applied to
The schools that most often appear alongside UC Santa Barbara on applicants’ lists, from our self-reported outcomes corpus.
On-campus criminal offenses classed as violent (murder/non-negligent manslaughter, rape, robbery, aggravated assault) for the most recent reported year. Source: U.S. Dept. of Education Campus Safety and Security (Clery Act). Counts reflect what’s reported to the school, and urban campuses often report more partly due to non-student incidents nearby — read alongside campus size and setting, not as a standalone safety verdict.
Climate
Pleasant days / yr
246
Summer high
81°F
Winter low
47°F
Annual rain
23.1"
Natural-hazard risk
Relatively High
Pleasant days counts days per year with a mean temperature of 55–75°F, a high at or below 90°F, a low at or above 45°F, and little precipitation — a transparent comfort measure, not a weighting we invented. Computed from Open-Meteo ERA5 daily history (2019–2023). Natural-hazard risk is the county’s composite rating from the FEMA National Risk Index.
Deep dive — research, future-scholar output & economic mobility▾
Research output
Institutional h-index
1,120
Scholarly works
139,945
Institutional research volume and impact from OpenAlex. The h-index reflects large research universities and will be low for teaching-focused liberal-arts colleges — not a measure of undergraduate quality.
Future-scholar output
Science & engineering PhDstop 37 nationally
Humanities & social-science PhDstop 43 nationally
Share of this school’s graduates who go on to earn research doctorates (2010–20), by national rank and per-capita yield (NSF institutional-yield ratio). A signal of a research-oriented student culture — not a causal promise, since it partly reflects who enrolls. Only top producers appear. Source: NSF NCSES, Baccalaureate Origins of U.S. Research Doctorate Recipients.
Economic mobility
Mobility rate
Quick answers
What is the acceptance rate at University of California-Santa Barbara?
University of California-Santa Barbara's acceptance rate is approximately 33% (Santa Barbara, CA), based on the most recent figures we compiled from public and primary sources.
How much does University of California-Santa Barbara cost?
At University of California-Santa Barbara, the average net price (after aid) is about $16,109 per year. Actual cost varies with financial aid and residency.
How many undergraduates attend University of California-Santa Barbara?
University of California-Santa Barbara enrolls approximately 23,113 undergraduate students.
Where is University of California-Santa Barbara located?
University of California-Santa Barbara is located in Santa Barbara, CA.
Admissions
Gaining admission to UCSB is a competitive proposition, with tens of thousands of applicants vying for a spot each year. The university does not offer an Early Decision program, and all applications are evaluated holistically based on the UC system's comprehensive review. The most recent first-year admit data shows an overall admit rate of 38.3%, with 42,170 students admitted from a pool of 110,178 applicants. The middle 50% of admitted freshmen boast a weighted high school GPA between 4.09 and 4.28. For the SAT, the middle 50% range is reported as 1230-1460, with a composite average around 1355. The university does not consider demonstrated interest as a factor in admissions decisions. A significant number of applicants—23% in one recent cycle—are offered a spot on the waitlist, though the exact number admitted from it varies. The rate—the percentage of admitted students who choose to enroll—is notably low, reported around 16-17%, indicating that many admitted students have other attractive options.
Earnings = median of students working ~10 years after entry; debt = median of graduates. Value divides 10-yr earnings by one year’s net price — read it as earnings per dollar of annual cost, not a full lifetime ROI; it favors lower-cost schools. Source: U.S. Dept. of Education College Scorecard. Figures lag ~2 years and reflect all students, not your intended major.
$59,485
Physics$52,107
Source: U.S. Dept. of Education College Scorecard (field-of-study earnings). Figures cover graduates who received federal aid and lag ~2 years; not all programs report data.
Co-application frequency from self-reported results — directional peer discovery, not a recommendation.
3.1%
Bottom → top quintile
50%
From bottom quintile
6%
Mobility rate = the share of students who both start in the bottom household-income quintile and reach the top quintile; bottom → top is that chance conditional on starting at the bottom. Source: Opportunity Insights Mobility Report Cards (Chetty, Friedman, Saez, Turner & Yagan). Reflects 1980–82 birth cohorts, so it’s directional, not current.
UCSB's academic identity is anchored by its formidable strength in the sciences, engineering, and mathematics, housed within three distinct colleges: the College of Letters and Science, the College of Engineering, and the unique College of Creative Studies. The university offers more than 200 majors, degrees, and credentials. Its engineering programs, particularly mechanical and chemical engineering, are highly ranked and form a core part of its reputation. The social sciences are the most popular major group, constituting 27% of degrees conferred, followed by biological and biomedical sciences (10%), psychology (10%), and mathematics and statistics (10%). Beyond the hard sciences, UCSB is also recognized for strong programs in communication and economics. The College of Creative Studies offers an intensive, conservatory-like environment for exceptionally motivated students in the arts, sciences, and mathematics. This combination creates an academic culture that is both broad in scope and deep in research intensity, especially in STEM fields.
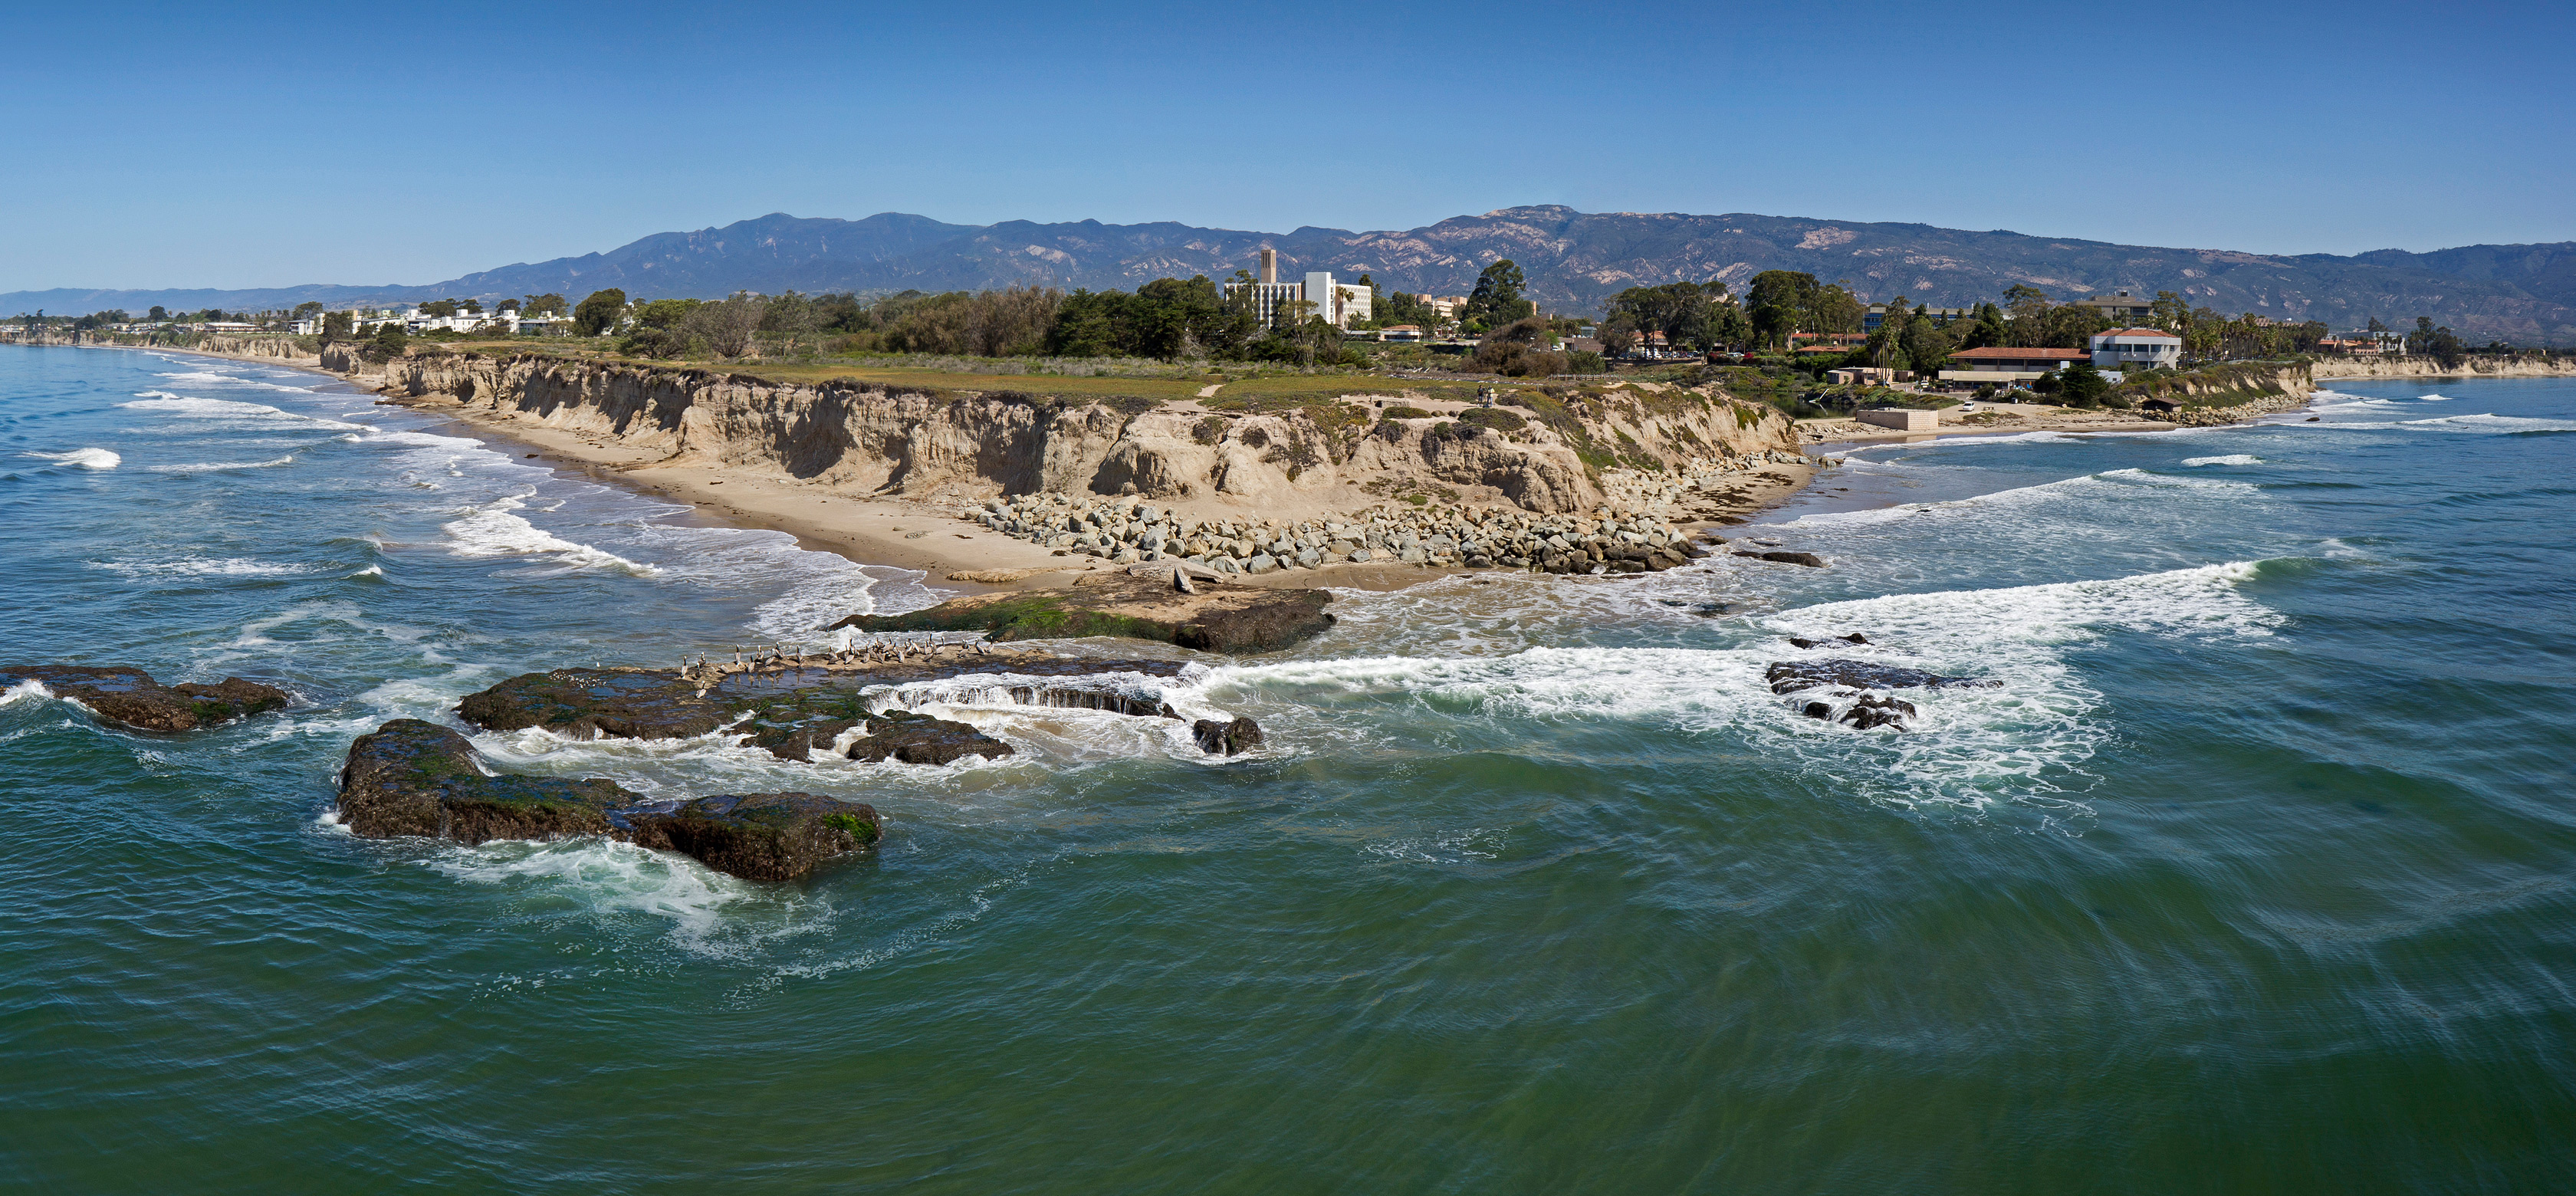
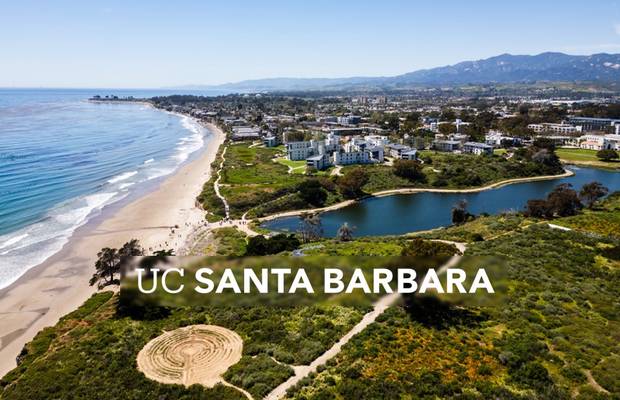
Life at UCSB is defined by its spectacular coastal location and the vibrant, active culture it inspires. The campus is a self-contained community perched on a bluff overlooking the Pacific Ocean, where the beach is a central part of daily life—for studying, socializing, surfing, or sunset-watching. The social scene is famously robust and inclusive, with students describing a culture where people "have each other's backs." The university supports over 500 student organizations, and the Student Resource Building houses five Cultural Resource Centers dedicated to the African diasporic, Chicanx/Latinx, Asian, American Indian, and Middle Eastern communities, fostering a supportive environment for diverse students. Bicycles are the primary mode of transportation on the sprawling, park-like campus. While the party school reputation persists in some circles, the reality is a balance of serious academic focus and a laid-back, collaborative social atmosphere fueled by the beautiful surroundings. The official Student Life Instagram showcases student journeys and involvement, highlighting the dynamic range of experiences available.
UCSB graduates enter the workforce with strong prospects. The four-year graduation rate is 70%, and the six-year rate is high. Alumni earnings are solid, with graduates working in California achieving median earnings higher than the state's median household income; more than half of these alumni earn over $100,000 in the long run. Early career earnings for graduates average around $43,000, which aligns with expectations given the mix of majors. The university's institutional research office provides detailed dashboards on student success rates, including retention and graduation metrics, underscoring a commitment to student progression and completion.
As a public university, UCSB's is significantly lower than that of comparable private institutions, especially for in-state students. The university offers a Net Price Calculator to help families estimate their eligibility for grants and scholarships. Financial aid is awarded based on an assessment of a family's demonstrated financial need. On average, total financial aid awarded is $24,695 per year, which can include federal grants, state grants (like the Cal Grant), and institutional grant aid. It is important to note that, unlike some elite private colleges, UCSB is not generally listed among institutions that meet 100% of demonstrated financial need with a no-loan policy for all qualifying students. Discussions among students suggest that financial aid packages may not always cover the full calculated need, leaving a gap that families must address with loans or other resources.
UCSB's singular appeal lies in its unmatched fusion of top-tier research university credentials with an irreplicable lifestyle. It's one of the few places where you can attend a lecture by a Nobel laureate in physics and be surfing in the Pacific Ocean an hour later. The academic heft is real and concentrated in high-demand fields like engineering, computer science, and the physical sciences, offering a rigorous education that directly translates to strong career outcomes. Yet, the campus culture defies the high-pressure stereotype often associated with such programs. The collaborative, supportive student vibe, the breathtaking natural environment, and the pervasive outdoor activity create a holistic college experience that is both intellectually demanding and personally enriching. It's a university that proves you don't have to sacrifice life for a degree, attracting students who are as serious about their futures as they are about enjoying the unique California present.
University of California-Santa Barbara seal · sourceUniversity of California, Santa Barbara campus - Wikipedia · sourceHome | UC Santa Barbara · sourceUniversity of California - Santa Barbara - Niche · source