Admit rate has ranged 40%–53% over the last 5 years — notably volatile. Source: IPEDS via Urban Institute.
Acceptance & SAT from Common Data Set / IPEDS; net price, earnings & graduation from the U.S. Dept. of Education College Scorecard. Figures lag ~1–2 years — verify with the school.

Stevens Institute of Technology is a high-octane, career-focused STEM powerhouse perched on the Hoboken waterfront, where the Manhattan skyline serves as a daily reminder of professional ambition. Its identity is a potent blend of rigorous, tech-infused academics—dominated by engineering and computer science—and a pragmatic, outcomes-driven culture that reliably converts students into highly paid professionals. The campus vibe is collaborative but intense, balancing demanding coursework with a tight-knit community and the unparalleled internship and social opportunities of the New York City metro area.
Admission requirements
Test-optional — scores considered if submitted
Required
High school transcript
Grade point average
Letters of recommendation
College-prep program
TOEFL (non-native English)
Considered (not required)
Test scores (SAT/ACT)
Demonstrated competencies
Source: IPEDS Admissions survey (2022) via Urban Institute. Covers formal factors only — it does not reflect essays, extracurriculars, or other holistic criteria.
More details
Undergrad enrollment
4,222
In-state tuition
$63,462
Out-of-state tuition
$63,462
Graduation Rate
87%
Demonstrated Interest
Considered
Median Earnings (10yr)
$108,772
Average Starting Salary
$86,900
First-Year Retention Rate
93.6%
Class of 2023 Outcomes Rate
93.4%
Student Gender Distribution
65.7% Men, 33.9% Women
No-Loan Policy (Begins Fall 2026)
Yes, full tuition for families earning < $200k with need
Outcomes & value
Outcomes & value
Median earnings (10 yr)
$108,772
Value (earnings ÷ net price)
2.6×
Median debt at graduation
$27,000
Graduation rate
87%
First-year retention
94%
Reducing loan balance (3 yr)
91%
Pell (lower-income) share
20%
First-gen share (among federal-aid recipients)
15%
Financial health
2.2 / 3.0Meets the federal financial-responsibility standard
U.S. Dept. of Education Financial Responsibility Composite Score (FY2022-23). Scale −1.0 to 3.0; ≥1.5 meets the standard. Reported for private nonprofit & for-profit institutions only — public universities are state-backed and not scored, so this is a stability signal, not a ranking.
Top-earning majors
Median earnings by field of study (highest credential), ~2 years after completion.
Computer Science$83,177
Computer Engineering$77,213
Electrical, Electronics, and Communications Engineering$77,213
Engineering-Related Fields$74,953
Civil Engineering$74,702
Business Administration, Management and Operations$73,635
Applicants here also applied to
The schools that most often appear alongside Stevens on applicants’ lists, from our self-reported outcomes corpus.
Co-application frequency from self-reported results — directional peer discovery, not a recommendation.
Campus & location
Campus safety
On-campus violent crimes (2024)
1
Per 1,000 students
0.12
On-campus criminal offenses classed as violent (murder/non-negligent manslaughter, rape, robbery, aggravated assault) for the most recent reported year. Source: U.S. Dept. of Education Campus Safety and Security (Clery Act). Counts reflect what’s reported to the school, and urban campuses often report more partly due to non-student incidents nearby — read alongside campus size and setting, not as a standalone safety verdict.
Climate
Pleasant days / yr
90
Summer high
83°F
Winter low
29°F
Annual rain
54.4"
Annual snow
18.3"
Natural-hazard risk
Relatively High
Pleasant days counts days per year with a mean temperature of 55–75°F, a high at or below 90°F, a low at or above 45°F, and little precipitation — a transparent comfort measure, not a weighting we invented. Computed from Open-Meteo ERA5 daily history (2019–2023). Natural-hazard risk is the county’s composite rating from the FEMA National Risk Index.
Deep dive — research, future-scholar output & economic mobility▾
Research output
Institutional h-index
306
Scholarly works
23,132
Institutional research volume and impact from OpenAlex. The h-index reflects large research universities and will be low for teaching-focused liberal-arts colleges — not a measure of undergraduate quality.
Economic mobility
Mobility rate
4.3%
Bottom → top quintile
62%
From bottom quintile
7%
Mobility rate = the share of students who both start in the bottom household-income quintile and reach the top quintile; bottom → top is that chance conditional on starting at the bottom. Source: Opportunity Insights Mobility Report Cards (Chetty, Friedman, Saez, Turner & Yagan). Reflects 1980–82 birth cohorts, so it’s directional, not current.
Quick answers
What is the acceptance rate at Stevens Institute of Technology?
Stevens Institute of Technology's acceptance rate is approximately 48% (Hoboken, NJ), based on the most recent figures we compiled from public and primary sources.
What SAT score do you need for Stevens Institute of Technology?
Admitted students at Stevens Institute of Technology typically score 1380–1505 on the SAT (the middle-50% range). Scores outside this band are still admitted, especially with strong applications.
How much does Stevens Institute of Technology cost?
At Stevens Institute of Technology, the average net price (after aid) is about $41,346 per year. Actual cost varies with financial aid and residency.
How many undergraduates attend Stevens Institute of Technology?
Stevens Institute of Technology enrolls approximately 4,222 undergraduate students.
Where is Stevens Institute of Technology located?
Stevens Institute of Technology is located in Hoboken, NJ.
Admissions
Stevens operates with a moderately selective admissions process, where applying early can significantly improve an applicant's odds. The overall is 48%, but the Early Decision acceptance rate is typically much higher—one source cites it at 72% compared to the regular decision rate. For the Fall 2025 incoming class, there were 10,499 applicants. The middle 50% SAT range for admitted students is 1380–1505, and academic preparation is paramount: 78% of admitted students report a GPA of 3.75 or higher. The university maintains a waitlist, and for a recent cycle, 3,383 applicants were offered a spot on it, with 1,562 accepting that spot and only 70 ultimately being admitted. Demonstrated interest is a factor considered in admissions decisions, as indicated by its inclusion in the . The rate—the percentage of admitted students who enroll—is not explicitly stated in the provided sources, but the incoming class size was 1,104 for Fall 2025. The undergraduate student body is predominantly male, with 65.7% men and 33.9% women.
Earnings = median of students working ~10 years after entry; debt = median of graduates. Value divides 10-yr earnings by one year’s net price — read it as earnings per dollar of annual cost, not a full lifetime ROI; it favors lower-cost schools. Source: U.S. Dept. of Education College Scorecard. Figures lag ~2 years and reflect all students, not your intended major.
Biomedical/Medical Engineering$71,015
Mechanical Engineering$68,778
Source: U.S. Dept. of Education College Scorecard (field-of-study earnings). Figures cover graduates who received federal aid and lag ~2 years; not all programs report data.
The academic experience at Stevens is unapologetically centered on technology, engineering, and quantitative fields. The curriculum is described as "challenging" and "tech-infused," offered across more than 300 areas of study for its 8,000 total students. The distribution of graduates underscores this focus: 43% in Engineering, 24% in Computer and Information Sciences, and 12% in Business, Management, and Marketing. This is not a liberal arts college; it's a place where creation, discovery, and leading-edge research are paramount, guided by faculty in a "right-size, supportive environment." The program's strengths are amplified by its "postgraduate connections" and the "easy access to New York City" for internships and professional networking. The university has earned recognition for specific programs, including a No. 1 ranking for Best Mathematics Master's Degrees and a No. 15 ranking for Best Biomedical Engineering Master's Degrees. The collaborative yet demanding environment is particularly noted for students pursuing engineering and technology.
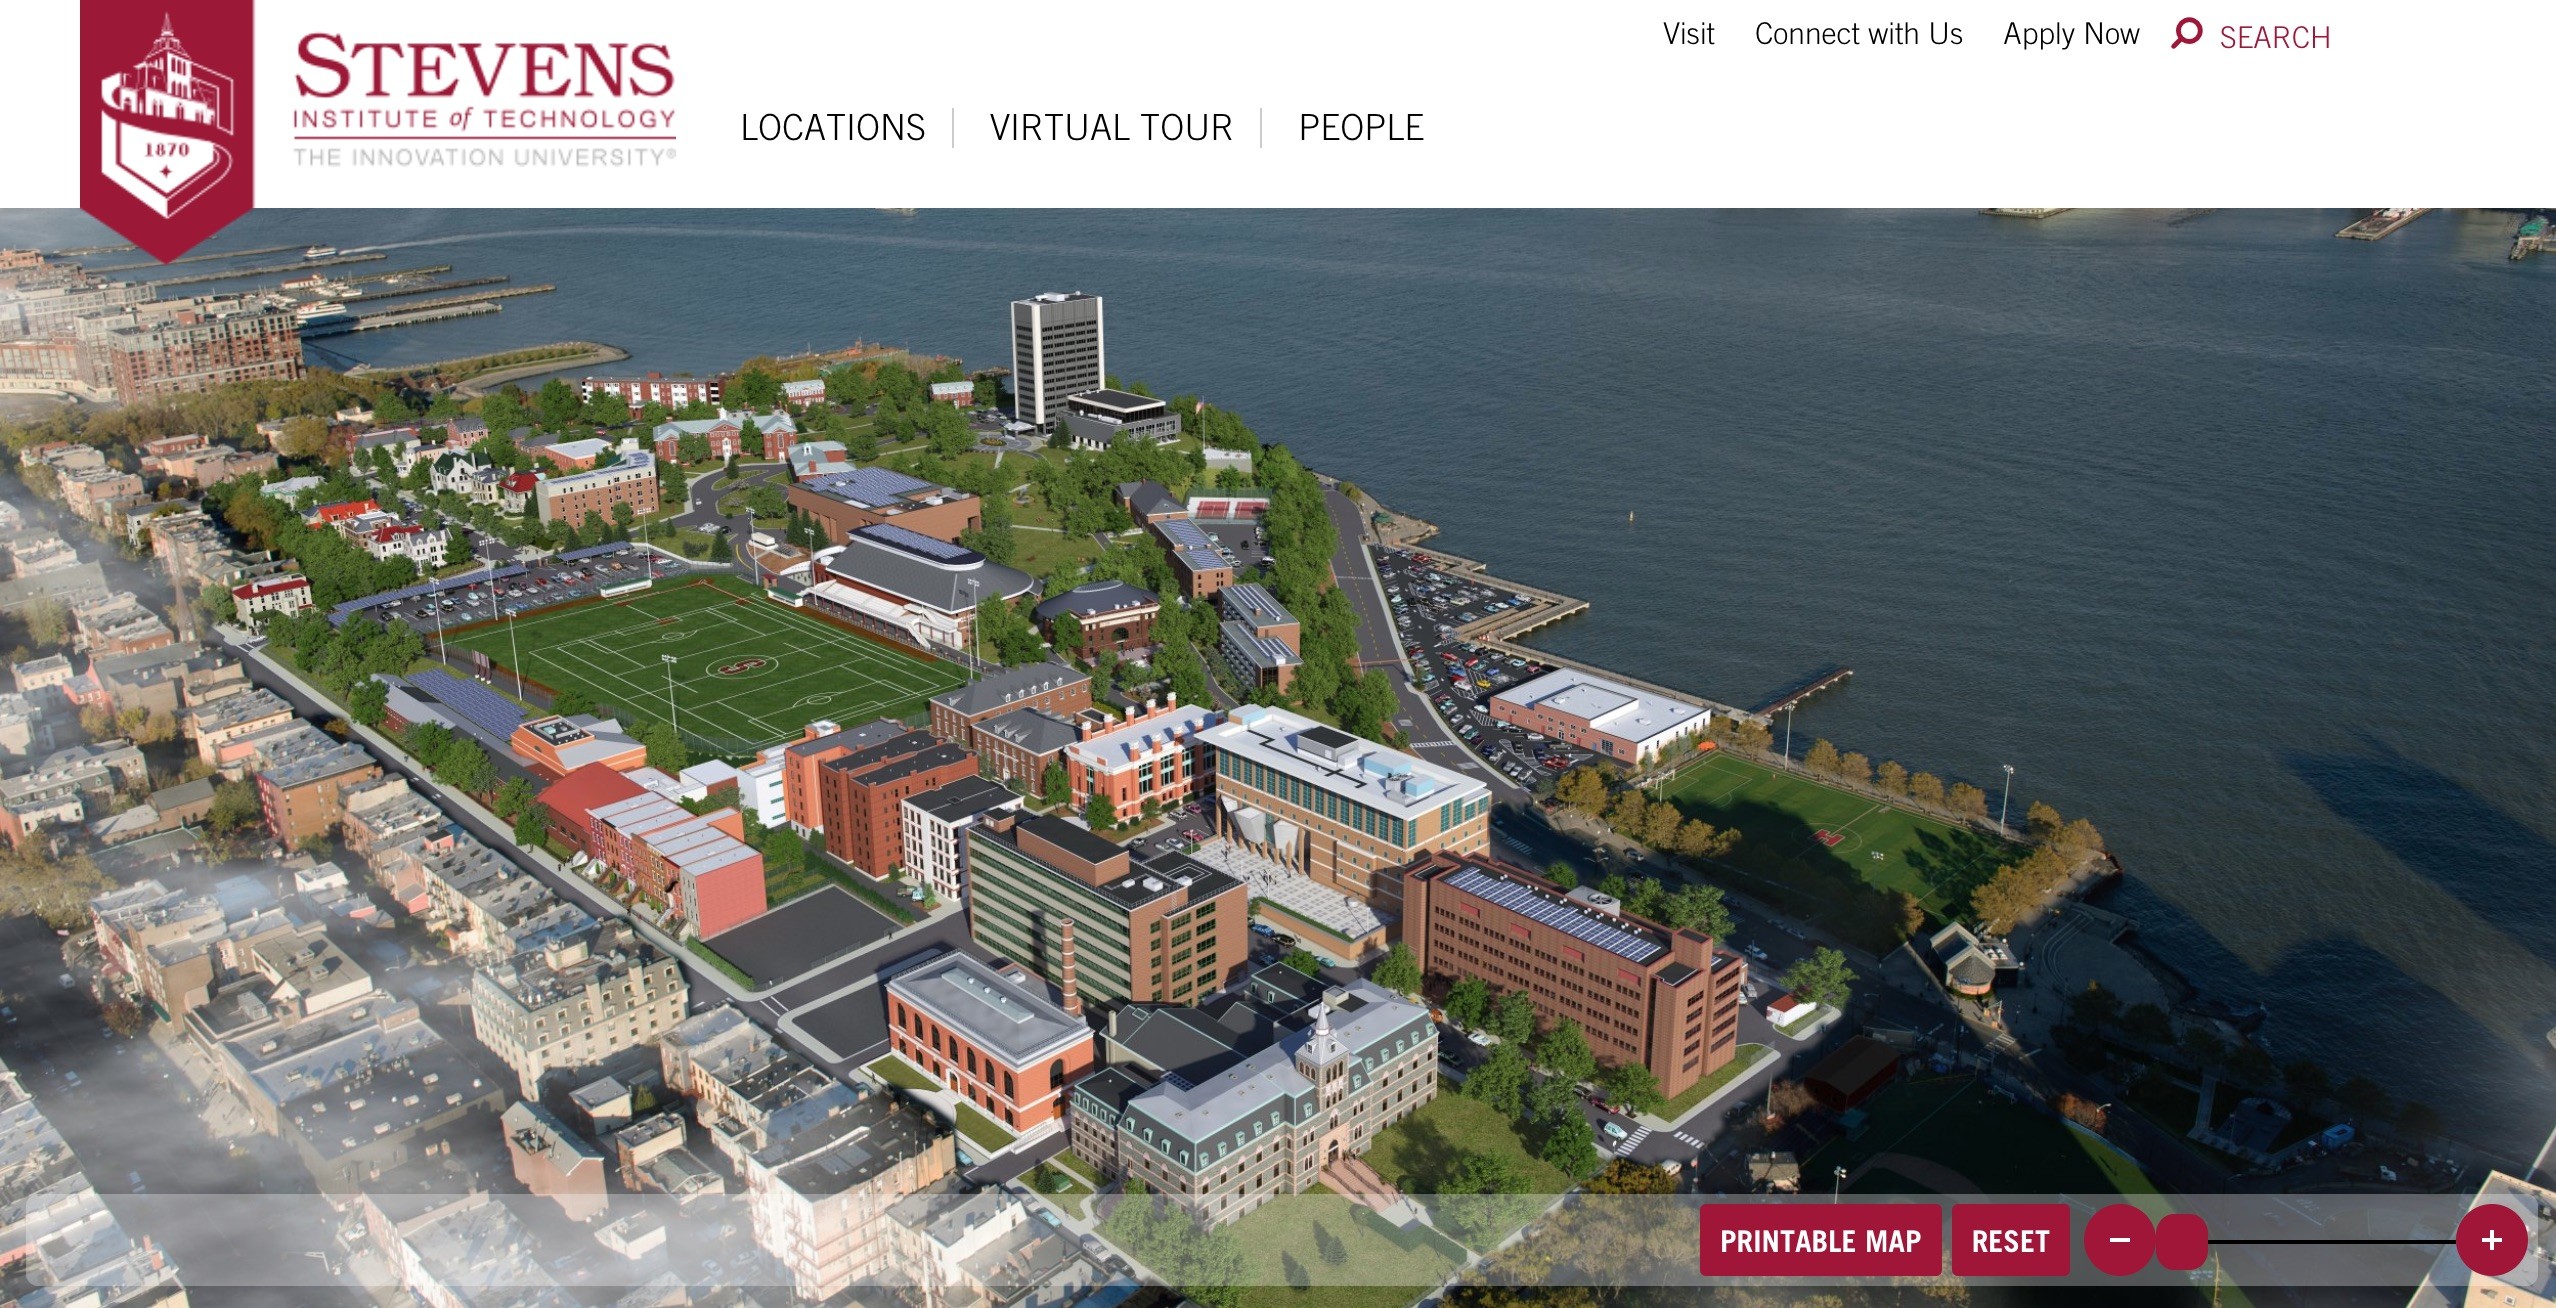
Life at Stevens unfolds on a "vibrant campus" in Hoboken, directly across the Hudson River from Manhattan. This location is a defining feature, providing immediate access to the immense social, cultural, and professional resources of New York City. On campus, student engagement is fostered through a wide array of clubs, organizations, fraternities and sororities, athletics, and arts programs. The Office of Student Affairs supports these initiatives, aiming to help students "learn and grow intellectually, personally and professionally outside of the traditional classroom." Campus traditions, clubs, and organizations are emphasized as key tools for building community. The social scene is a mix of on-campus activities and the offerings of Hoboken, which include bars and restaurants. While the academic workload is significant, the university promotes a "supportive campus environment" where students are empowered to build a balanced life. Discussions among students acknowledge the demanding academics but highlight the collaborative culture and the unique advantages of the location.
The return on investment from a Stevens education is exceptionally clear and is the cornerstone of the university's reputation. Outcomes for graduates are outstanding. For the Class of 2023, 93.4% of graduates achieved their desired outcome—either employment or enrollment in graduate school—within six months of graduation. The average starting salary for that class was $86,900, and 83% of graduates completed at least one internship during their studies. The longer-term earnings power is even more impressive: federal data shows Stevens graduates earn a median salary of approximately $113,000 just four years after graduation. This performance ranks Stevens tied for No. 26 nationally for graduate earnings, and No. 1 in New Jersey, placing it in the top 1% of universities nationwide. The institution also boasts strong retention and completion rates, with a 93.6% first-year retention rate and a 90% six-year graduation rate, which ranks No. 45 nationally.
Attending Stevens requires a significant financial investment, but the university provides substantial aid to offset costs. The average after aid is $41,346. For students receiving aid, the average aid package awarded is $38,334, with the need-based scholarship or grant portion averaging $34,561. Stevens offers need-based Stevens Grants, which do not need to be repaid, to eligible students who demonstrate financial need. Crucially, the university has announced a major new financial aid policy beginning in fall 2026: it will offer full tuition coverage for students from families with annual incomes of $200,000 or less who demonstrate significant financial need. This "no-loan" style policy means qualifying students will have their full tuition met with grants and scholarships, not loans. To remain eligible for all forms of financial aid, students must meet specific terms and conditions set by the university.
Stevens Institute of Technology carves out a distinctive niche by masterfully combining three powerful elements: a rigorous, specialized STEM curriculum, an unbeatable location for career launch, and a relentless focus on tangible, high-value outcomes. It’s not trying to be an Ivy League clone; it’s a pragmatic engine for professional success. The skyline of Manhattan isn't just a pretty view—it's a daily symbol of the internship, research, and job market at students' fingertips, a advantage leveraged by what students call "postgraduate connections." This direct pipeline to industry translates into a staggering earnings premium for graduates, who rank in the top 1% nationally for mid-career salary. The upcoming no-loan tuition guarantee for middle- and upper-middle-income families signals a serious commitment to accessibility, aligning cost with the proven ROI. For a student certain of a future in engineering, tech, or quantitative business, Stevens offers a focused, supportive, and intensely career-effective alternative to larger, more diffuse research universities.
Stevens Institute of Technology seal · sourceVisit Campus & Campus Tours | Stevens Institute of Technology · sourceStevens Institute of Technology Launches Virtual Tour And Interactive Campus Map | Stevens Institute of Technology · sourceStevens Institute of Technology · source
_(14598280638).jpg?width=1600)