Admit rate has ranged 16%–27% over the last 5 years — notably volatile. Source: IPEDS via Urban Institute.
Acceptance & SAT from Common Data Set / IPEDS; net price, earnings & graduation from the U.S. Dept. of Education College Scorecard. Figures lag ~1–2 years — verify with the school.
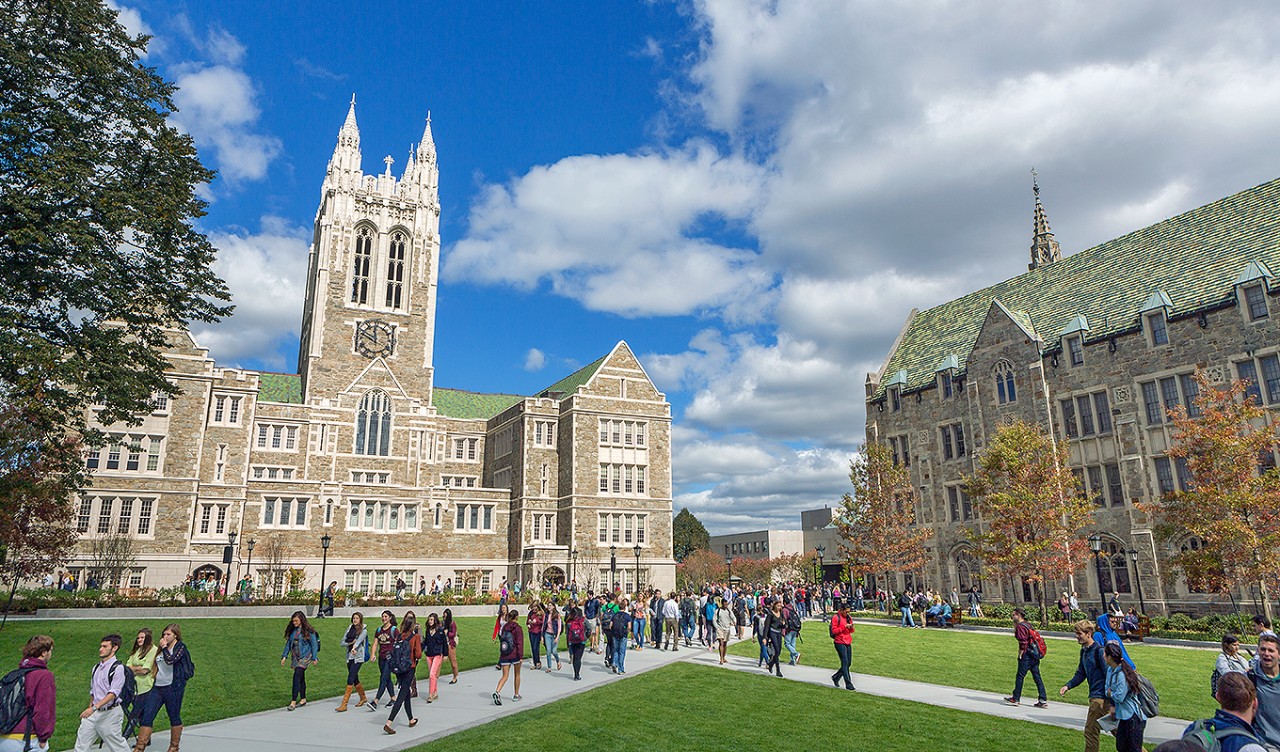
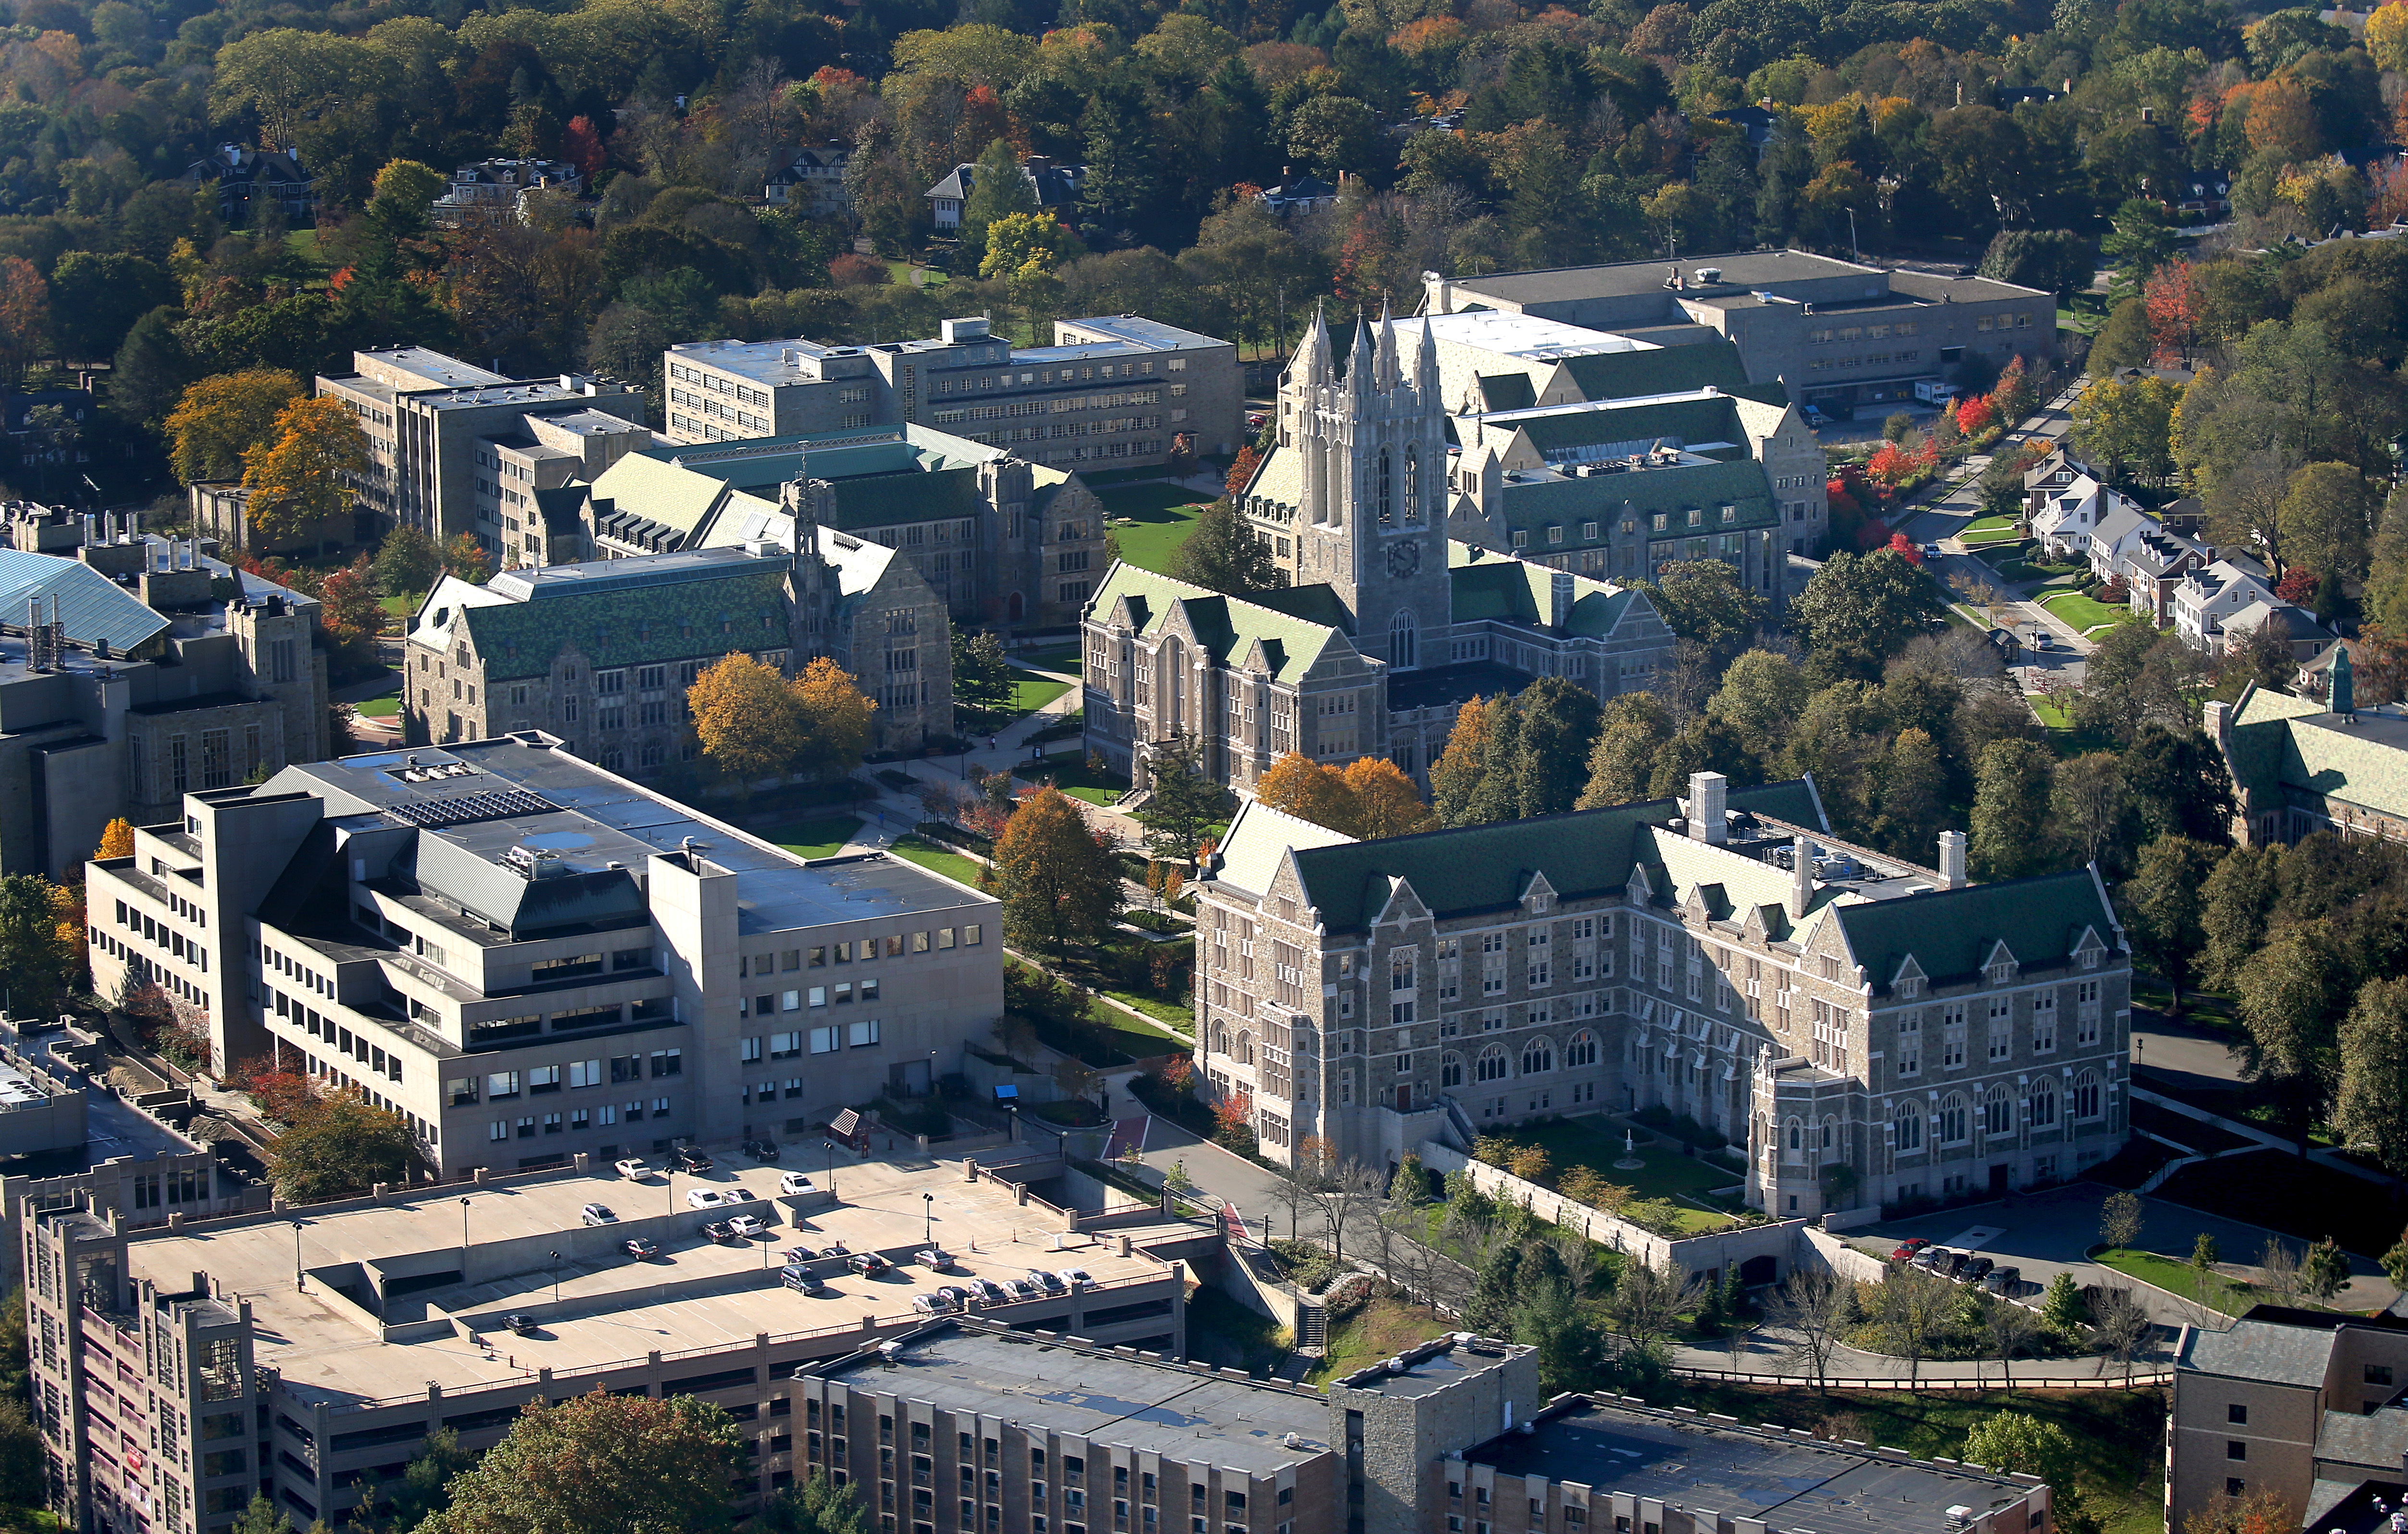
Boston College is a Jesuit research university that masquerades as a liberal arts college, offering a high-touch undergraduate experience with a distinctly pre-professional bent. Its Chestnut Hill campus fosters a tight-knit, socially active community where students balance rigorous academics—especially in its powerhouse Carroll School of Management—with a classic collegiate atmosphere. The result is a graduate with a strong liberal arts foundation, a polished resume, and a network that reliably opens doors to six-figure careers.
Admission requirements
Test-optional — scores considered if submitted
Required
High school transcript
Grade point average
Letters of recommendation
College-prep program
TOEFL (non-native English)
Considered (not required)
Class rank
Test scores (SAT/ACT)
Demonstrated competencies
Source: IPEDS Admissions survey (2022) via Urban Institute. Covers formal factors only — it does not reflect essays, extracurriculars, or other holistic criteria.
More details
Undergrad enrollment
10,085
In-state tuition
$70,702
Out-of-state tuition
$70,702
Graduation Rate
91%
Meets Full Need
Yes
Most Popular Majors
Economics, Biology, Finance
Demonstrated Interest
Considered
Median Earnings (10yr)
$103,937
Outcomes & value
Outcomes & value
Median earnings (10 yr)
$103,937
Value (earnings ÷ net price)
2.5×
Median debt at graduation
$19,000
Graduation rate
91%
First-year retention
96%
Reducing loan balance (3 yr)
91%
Pell (lower-income) share
13%
First-gen share (among federal-aid recipients)
13%
Financial health
3.0 / 3.0Meets the federal financial-responsibility standard
U.S. Dept. of Education Financial Responsibility Composite Score (FY2022-23). Scale −1.0 to 3.0; ≥1.5 meets the standard. Reported for private nonprofit & for-profit institutions only — public universities are state-backed and not scored, so this is a stability signal, not a ranking.
Top-earning majors
Median earnings by field of study (highest credential), ~2 years after completion.
Computer Science$84,100
Information Science/Studies$76,460
Finance and Financial Management Services$75,518
Registered Nursing, Nursing Administration, Nursing Research and Clinical Nursing$71,015
Mathematics$70,596
Accounting and Related Services
Applicants here also applied to
The schools that most often appear alongside Boston College on applicants’ lists, from our self-reported outcomes corpus.
Co-application frequency from self-reported results — directional peer discovery, not a recommendation.
Campus & location
Campus safety
On-campus violent crimes (2024)
6
Per 1,000 students
0.39
On-campus criminal offenses classed as violent (murder/non-negligent manslaughter, rape, robbery, aggravated assault) for the most recent reported year. Source: U.S. Dept. of Education Campus Safety and Security (Clery Act). Counts reflect what’s reported to the school, and urban campuses often report more partly due to non-student incidents nearby — read alongside campus size and setting, not as a standalone safety verdict.
Climate
Pleasant days / yr
91
Summer high
81°F
Winter low
25°F
Annual rain
49"
Annual snow
31.4"
Natural-hazard risk
Relatively High
Pleasant days counts days per year with a mean temperature of 55–75°F, a high at or below 90°F, a low at or above 45°F, and little precipitation — a transparent comfort measure, not a weighting we invented. Computed from Open-Meteo ERA5 daily history (2019–2023). Natural-hazard risk is the county’s composite rating from the FEMA National Risk Index.
Deep dive — research, future-scholar output & economic mobility▾
Research output
Institutional h-index
571
Scholarly works
47,123
Institutional research volume and impact from OpenAlex. The h-index reflects large research universities and will be low for teaching-focused liberal-arts colleges — not a measure of undergraduate quality.
Economic mobility
Mobility rate
1.6%
Bottom → top quintile
56%
From bottom quintile
3%
Mobility rate = the share of students who both start in the bottom household-income quintile and reach the top quintile; bottom → top is that chance conditional on starting at the bottom. Source: Opportunity Insights Mobility Report Cards (Chetty, Friedman, Saez, Turner & Yagan). Reflects 1980–82 birth cohorts, so it’s directional, not current.
Quick answers
What is the acceptance rate at Boston College?
Boston College's acceptance rate is approximately 16% (Chestnut Hill, MA), based on the most recent figures we compiled from public and primary sources.
What SAT score do you need for Boston College?
Admitted students at Boston College typically score 1440–1540 on the SAT (the middle-50% range). Scores outside this band are still admitted, especially with strong applications.
How much does Boston College cost?
At Boston College, the average net price (after aid) is about $41,704 per year. Actual cost varies with financial aid and residency.
How many undergraduates attend Boston College?
Boston College enrolls approximately 10,085 undergraduate students.
Where is Boston College located?
Boston College is located in Chestnut Hill, MA.
Admissions
Gaining admission to Boston College is a fiercely competitive endeavor, with the university sifting through tens of thousands of applications for a freshman class of around 2,500. The overall hovers around 14-16%, but the landscape is dramatically different for Early Decision applicants. Applying ED is the most strategic path, with roughly 30% of ED applicants admitted compared to the single-digit rates of Regular Decision. The admitted student profile is academically elite, with the middle 50% SAT range sitting between 1440 and 1540. The university aims to fill a significant portion—historically targeting around 40%—of its class through Early Decision, making the Regular Decision pool exceptionally challenging. Demonstrated interest is a factor Boston College considers in its admissions process.
Earnings = median of students working ~10 years after entry; debt = median of graduates. Value divides 10-yr earnings by one year’s net price — read it as earnings per dollar of annual cost, not a full lifetime ROI; it favors lower-cost schools. Source: U.S. Dept. of Education College Scorecard. Figures lag ~2 years and reflect all students, not your intended major.
$69,937
Economics$69,069
Business Administration, Management and Operations$63,997
Source: U.S. Dept. of Education College Scorecard (field-of-study earnings). Figures cover graduates who received federal aid and lag ~2 years; not all programs report data.
BC’s academic identity is defined by its intense focus on undergraduate education within a research university framework. The curriculum is anchored by a robust core, ensuring all students—regardless of major—receive a broad liberal arts foundation. The most popular majors reflect a student body with clear professional ambitions: Economics, Biology, and Finance dominate the graduation lists. The Carroll School of Management is a particular draw, offering highly-regarded programs in Finance, Accounting, and Management. Beyond business, the university offers a wide array of majors from Applied Physics and Biochemistry to Classics and African and African Diaspora Studies. The academic culture is often described as collaborative yet demanding, with the relatively small undergraduate population allowing for significant faculty attention.
Life on the Chestnut Hill campus operates on a well-understood "work hard, play hard" rhythm. Social life is vibrant and largely self-contained, with a heavy emphasis on student organizations, athletics, and dorm-based gatherings. The party scene exists but is described as limited and heavily policed, leading much of the social activity to occur in dorm rooms and off-campus apartments. Alcohol is prevalent, even in freshman housing. The campus community is notably tight-knit, with a strong focus on supporting AHANA, multicultural, and multiethnic students. While Boston's vast resources are just a train ride away, many students find the on-campus atmosphere sufficiently engaging, creating a classic collegiate bubble where traditions and school spirit run high.
A Boston College degree is a remarkably reliable ticket to professional success. The graduation rate is exceptionally high, and the vast majority of graduates land squarely on their feet. For the Class of 2025, 96.6% of graduates were either employed or enrolled in graduate school within six months of commencement, with a median starting salary of $74,000. The long-term financial payoff is even more impressive, with median earnings soaring to over $103,000 a decade after entry. This strong return on investment is fueled by BC's powerful alumni network, particularly in finance, consulting, and law, and the university's dedicated career center that facilitates these high-caliber placements.
Attending Boston College commands a premium price, but the university mitigates this for many families through a robust, need-based financial aid program. Crucially, BC is committed to meeting 100% of the demonstrated institutional need for every student who applies for aid on time. This means the university calculates a family's need based on its own criteria (which can differ from the FAFSA's Expected Family Contribution) and covers that full amount with a package of grants, scholarships, work-study, and loans. The average after aid is $41,704. While the aid is generous, it is exclusively need-based; there are no merit scholarships. For families who qualify, the policy can make BC surprisingly affordable, with many students reporting minimal unmet need.
Boston College occupies a unique and coveted niche in American higher education. It successfully blends the intimate, formative experience of a liberal arts college—with its demanding core curriculum and focus on undergraduate teaching—with the resources, research opportunities, and career-launching power of a major private research university. Its Jesuit heritage infuses the campus with a palpable sense of community service and intellectual purpose, yet this is seamlessly integrated with a sharply pre-professional student body focused on Wall Street, consulting firms, and top graduate schools. The result is a culture of both idealism and ambition. Furthermore, its binding Early Decision policy and high rate create a class of students deeply committed to the BC experience from day one, fostering an unusually cohesive and spirited campus life that feels both classic and connected to the pulse of a world-class city.
Boston College seal · sourceBoston College (BC) - Profile, Rankings and Data | US News Best Colleges · sourceBC intends to hold classes on campus, as other colleges wrestle with decisions on fall semester - The Boston Globe · sourceEver to Excel: A History of Boston College · source