Admit rate has ranged 67%–74% over the last 5 years. Source: IPEDS via Urban Institute.
Acceptance & SAT from Common Data Set / IPEDS; net price, earnings & graduation from the U.S. Dept. of Education College Scorecard. Figures lag ~1–2 years — verify with the school.
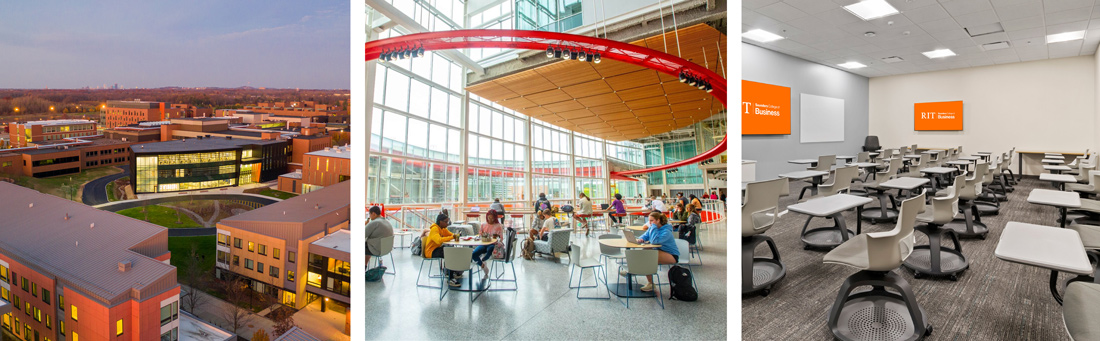
Rochester Institute of Technology is a private research powerhouse where the academic culture is defined by a relentless, hands-on pragmatism. It’s a place where co-ops aren’t an extracurricular but a core curriculum component, funneling students directly into high-paying tech and engineering roles. The vibe is industrious and collaborative, set against a backdrop of Rochester winters and a sprawling, tunnel-connected campus buzzing with project teams and gamers.
Admission requirements
Test-optional — scores considered if submitted
Required
High school transcript
Grade point average
Letters of recommendation
College-prep program
Demonstrated competencies
TOEFL (non-native English)
Considered (not required)
Class rank
Test scores (SAT/ACT)
Source: IPEDS Admissions survey (2022) via Urban Institute. Covers formal factors only — it does not reflect essays, extracurriculars, or other holistic criteria.
More details
Undergrad enrollment
13,215
In-state tuition
$59,274
Out-of-state tuition
$59,274
No-Loan Policy
No
Graduation Rate
70%
Meets Full Need
No
ED Share of Class
~47%
On-Campus Housing
49%
Demonstrated Interest
Considered
Median Earnings (10yr)
$76,571
Outcomes & value
Outcomes & value
Median earnings (10 yr)
$76,571
Value (earnings ÷ net price)
2.2×
Median debt at graduation
$26,778
Graduation rate
70%
First-year retention
89%
Reducing loan balance (3 yr)
77%
Pell (lower-income) share
27%
First-gen share (among federal-aid recipients)
19%
Financial health
3.0 / 3.0Meets the federal financial-responsibility standard
U.S. Dept. of Education Financial Responsibility Composite Score (FY2022-23). Scale −1.0 to 3.0; ≥1.5 meets the standard. Reported for private nonprofit & for-profit institutions only — public universities are state-backed and not scored, so this is a stability signal, not a ranking.
Top-earning majors
Median earnings by field of study (highest credential), ~2 years after completion.
Computer/Information Technology Administration and Management$89,006
Computer Science$84,653
Computer Engineering$79,389
Computer Systems Networking and Telecommunications$72,901
Electrical, Electronics, and Communications Engineering$71,351
Management Information Systems and Services
Applicants here also applied to
The schools that most often appear alongside Rochester Institute of Technology on applicants’ lists, from our self-reported outcomes corpus.
On-campus criminal offenses classed as violent (murder/non-negligent manslaughter, rape, robbery, aggravated assault) for the most recent reported year. Source: U.S. Dept. of Education Campus Safety and Security (Clery Act). Counts reflect what’s reported to the school, and urban campuses often report more partly due to non-student incidents nearby — read alongside campus size and setting, not as a standalone safety verdict.
Climate
Pleasant days / yr
92
Summer high
80°F
Winter low
23°F
Annual rain
41.7"
Annual snow
41.4"
Natural-hazard risk
Relatively Moderate
Pleasant days counts days per year with a mean temperature of 55–75°F, a high at or below 90°F, a low at or above 45°F, and little precipitation — a transparent comfort measure, not a weighting we invented. Computed from Open-Meteo ERA5 daily history (2019–2023). Natural-hazard risk is the county’s composite rating from the FEMA National Risk Index.
Deep dive — research, future-scholar output & economic mobility▾
Research output
Institutional h-index
512
Scholarly works
30,614
Institutional research volume and impact from OpenAlex. The h-index reflects large research universities and will be low for teaching-focused liberal-arts colleges — not a measure of undergraduate quality.
Economic mobility
Mobility rate
3.3%
Bottom → top quintile
52%
From bottom quintile
6%
Mobility rate = the share of students who both start in the bottom household-income quintile and reach the top quintile; bottom → top is that chance conditional on starting at the bottom. Source: Opportunity Insights Mobility Report Cards (Chetty, Friedman, Saez, Turner & Yagan). Reflects 1980–82 birth cohorts, so it’s directional, not current.
Quick answers
What is the acceptance rate at Rochester Institute of Technology?
Rochester Institute of Technology's acceptance rate is approximately 67% (Rochester, NY), based on the most recent figures we compiled from public and primary sources.
What SAT score do you need for Rochester Institute of Technology?
Admitted students at Rochester Institute of Technology typically score 1300–1460 on the SAT (the middle-50% range). Scores outside this band are still admitted, especially with strong applications.
How much does Rochester Institute of Technology cost?
At Rochester Institute of Technology, the average net price (after aid) is about $34,906 per year. Actual cost varies with financial aid and residency.
How many undergraduates attend Rochester Institute of Technology?
Rochester Institute of Technology enrolls approximately 13,215 undergraduate students.
Where is Rochester Institute of Technology located?
Rochester Institute of Technology is located in Rochester, NY.
Admissions
RIT’s admissions process is competitive but personal, with a clear strategic advantage for those who apply early. The overall sits at 67%, but the Early Decision (ED) pathway is significantly more favorable. For the 2023-24 cycle, RIT received 1,822 ED applications and admitted 1,326, resulting in an ED acceptance rate of approximately 73%. In contrast, the Regular Decision pool saw 22,249 applicants and 15,797 admits, a rate of about 71%. This creates a substantial 'early advantage,' where nearly half of the enrolling first-year class can be filled through binding ED plans. The university considers a student's academic record to be of paramount importance. According to the , 'Very Important' factors include the rigor of secondary school record, class rank, GPA, and standardized test scores (though tests are optional). 'Important' factors include the application essay, recommendations, extracurricular activities, talent/ability, and character/personal qualities. Notably, demonstrated interest is 'Considered' in the admissions process, meaning visiting campus, engaging with admissions reps, or applying early can positively impact a decision. The middle 50% SAT range for admitted students is 1300–1460, and the middle 50% ACT range is 27–33. The academic profile is strong, with a significant majority of admitted students presenting high school GPAs of 3.5 and above.
Earnings = median of students working ~10 years after entry; debt = median of graduates. Value divides 10-yr earnings by one year’s net price — read it as earnings per dollar of annual cost, not a full lifetime ROI; it favors lower-cost schools. Source: U.S. Dept. of Education College Scorecard. Figures lag ~2 years and reflect all students, not your intended major.
$71,015
Chemical Engineering$69,338
Electromechanical Technologies/Technicians$69,338
Source: U.S. Dept. of Education College Scorecard (field-of-study earnings). Figures cover graduates who received federal aid and lag ~2 years; not all programs report data.
RIT is nationally recognized as a powerhouse of innovation, particularly in STEM and creative technology fields. It offers an incredible array of over 80 undergraduate degree programs, with a distinctive emphasis on experiential learning that is woven directly into the fabric of its curriculum. The university is a top 100 national institution, highly regarded for its rigorous and hands-on academic programs in technology, engineering, computing, business, and game design. Its signature cooperative education (co-op) program is a cornerstone, requiring students in many majors to complete substantial, paid work experience with one of over 4,500 employer partners worldwide before graduation. This isn't just an internship program; it's integrated academic credit and a primary reason for RIT's stellar employment outcomes. The academic environment is built around practical application, supported by sophisticated facilities and a diverse, committed faculty. Key areas of national leadership and ranking include:
Computing and Technology: Strong programs in computer science, information technology, and software engineering.
Engineering: A broad range of engineering disciplines with a focus on hands-on, project-based learning.
Game Design and Development: Consistently ranked among the best in the world.
Imaging Science and Photography: Home to the renowned School of Photographic Arts and Sciences.
Business and Entrepreneurship: Programs that often blend technology with management principles.
The focus is squarely on preparing students for specific careers, encouraging them to 'focus on what you love' and tap into their passions through direct, applicable study.
Life at RIT is defined by a unique, industrious culture that balances intense academic focus with a strong, quirky sense of community. The campus is a self-contained hub in the suburb of Henrietta, where about 49% of students live in college-owned housing and 51% live off-campus. Students often describe the culture as collaborative rather than cutthroat, with a shared understanding of the workload. A defining physical feature is the extensive tunnel system connecting many buildings—a beloved necessity during the long, snowy Rochester winters, which are a well-known part of the RIT experience. The Center for Campus Life works to create spaces and events where every student feels included, supporting over 300 student clubs and organizations. These range from professional and academic societies to special interest clubs centered on everything from anime to robotics. Campus traditions and large-scale events provide rhythmic social highlights throughout the year. The social scene is heavily activity-based, revolving around club meetings, hackathons, project teams (like the renowned Formula SAE team), and gaming—RIT has a massive and passionate community of gamers. While the campus buzzes with activity, the overall vibe is often described as more focused and less dominated by Greek life or big-time sports than at some universities, attracting students who are deeply passionate about their fields and hobbies.
RIT’s investment in hands-on, career-focused education pays off in exceptionally strong post-graduation results. The university boasts a 70% graduation rate, placing it within the top tier of institutions nationally. More impressively, outcomes for employed graduates have climbed to record-breaking highs. For the Class of 2025, the average early-career salary for bachelor's degree recipients reached $73,300. When combined with master's degree graduates, the overall average starting salary hit $80,200. These figures represent significant increases from previous years and underscore the high market value of an RIT degree. The co-op program is the engine behind these outcomes, providing students with an average of one year of professional work experience before they even graduate. This leads to high employment rates within six months of graduation, with many students receiving job offers from their co-op employers. The median earnings for RIT alumni ten years after entry are $76,571, which runs about 50% higher than national averages. The career trajectory remains strong, with reported mid-career salaries for alumni reaching approximately $140,100. RIT systematically publishes full-time salaries, outcome rates, and typical job titles for graduates, providing transparent evidence of its return on investment.
As a private institution, RIT carries a high sticker price, but the university works to offset this through a combination of merit scholarships and . The average after grants and scholarships is $34,906. Financial aid packages are built using the official budgets, and the university strongly encourages all prospective students to use its official Net Price Calculator for a personalized estimate. Aid primarily comes in the form of grants (which do not need to be repaid, based on FAFSA results) and loans. It is important to note that, based on available sources, RIT is not listed among the colleges that meet 100% of demonstrated financial need without loans. While it offers substantial merit-based awards, especially to attract high-achieving students, families should be prepared that need-based packages will typically include a federal loan component. The advice from current students is unequivocal: run the Net Price Calculator early and often to understand the real cost, and actively seek out both need-based and merit-based scholarship opportunities.
RIT distinguishes itself through an uncompromising, almost vocational commitment to applied learning. It’s a university built for doers, makers, and solvers. While many schools talk about experiential education, RIT has systematized it through its mandatory co-op program, ensuring every graduate enters the job market with a substantial resume, professional connections, and often, a job offer in hand. This creates a tangible, high-return pathway that directly links classroom theory to industry practice. The culture reflects this practicality: it’s a campus of project teams, hackathons, and studios, where students are more likely to bond over a coding problem or a robotics competition than a football game. This focus attracts a specific type of student—highly motivated, technically inclined, and clear-eyed about their career goals—and fosters a collaborative, rather than purely competitive, atmosphere. Furthermore, RIT has carved out niches of excellence in fields where it is a global leader, particularly in game design, imaging science, and accessible technology. It’s not a liberal arts college with a tech wing; technology, creativity, and business are its core liberal arts. For students who want to build, create, and engineer their future from day one, RIT offers a direct and proven pipeline to high-impact careers.
Rochester Institute of Technology seal · sourceRochester Institute of Technology | RIT · sourceUndergraduate Campus Visit · sourceRochester Institute of Technology (RIT) - Profile, Rankings and Data | US News Best Colleges · source