Admit rate has ranged 68%–80% over the last 5 years — notably volatile, though the latest figure above (81%) falls outside that window. Source: IPEDS via Urban Institute.
Acceptance & SAT from Common Data Set / IPEDS; net price, earnings & graduation from the U.S. Dept. of Education College Scorecard. Figures lag ~1–2 years — verify with the school.
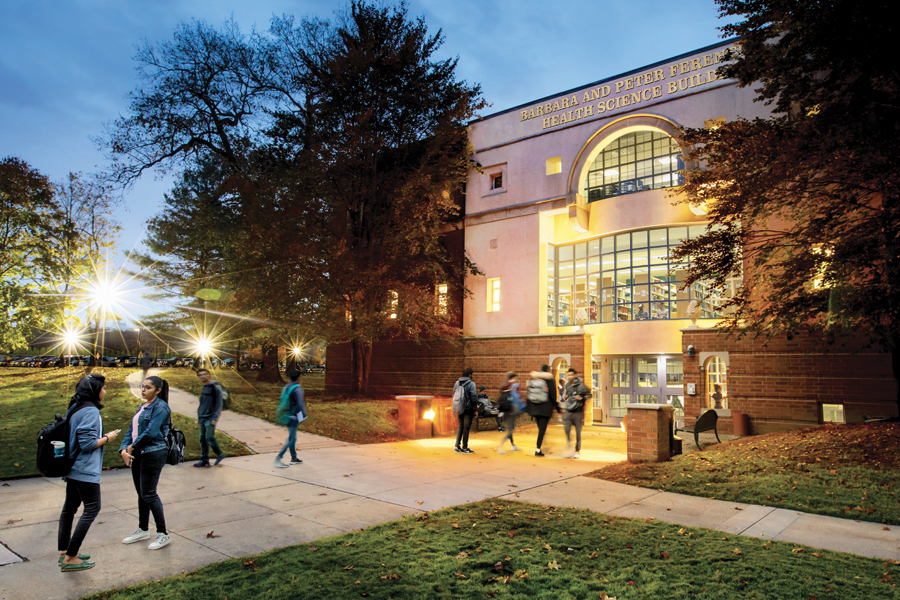
New York Institute of Technology is a private, tech-infused university that operates like a career accelerator with campuses in suburban Long Island and the heart of Manhattan. It’s defined by a pragmatic, industry-focused curriculum in fields like cybersecurity, AI, robotics, and health sciences, delivered with a lean 12:1 student-faculty ratio. The vibe is less about ivy-covered quads and more about connecting students directly to the professional engines of New York City, though this comes with a highly commuter-centric student life where 93% live off-campus.
Admission requirements
Test-optional — scores considered if submitted
Required
High school transcript
Grade point average
Letters of recommendation
College-prep program
Demonstrated competencies
TOEFL (non-native English)
Considered (not required)
Test scores (SAT/ACT)
Source: IPEDS Admissions survey (2022) via Urban Institute. Covers formal factors only — it does not reflect essays, extracurriculars, or other holistic criteria.
More details
Undergrad enrollment
3,440
In-state tuition
$46,560
Out-of-state tuition
$46,560
Live On-Campus
7%
Graduation Rate
59%
Early Decision Offered
No
Median Earnings (10yr)
$70,080
Student-to-Faculty Ratio
12:1
Outcomes & value
Outcomes & value
Median earnings (10 yr)
$70,080
Value (earnings ÷ net price)
3.1×
Median debt at graduation
$23,334
Graduation rate
59%
First-year retention
78%
Reducing loan balance (3 yr)
58%
Pell (lower-income) share
45%
First-gen share (among federal-aid recipients)
33%
Financial health
3.0 / 3.0Meets the federal financial-responsibility standard
U.S. Dept. of Education Financial Responsibility Composite Score (FY2022-23). Scale −1.0 to 3.0; ≥1.5 meets the standard. Reported for private nonprofit & for-profit institutions only — public universities are state-backed and not scored, so this is a stability signal, not a ranking.
Top-earning majors
Median earnings by field of study (highest credential), ~2 years after completion.
Registered Nursing, Nursing Administration, Nursing Research and Clinical Nursing$91,744
Mechanical Engineering$70,456
Electrical, Electronics, and Communications Engineering$62,012
Computer and Information Sciences, General$51,482
Architecture$48,823
Architectural Sciences and Technology
Applicants here also applied to
The schools that most often appear alongside New York Institute of Technology on applicants’ lists, from our self-reported outcomes corpus.
On-campus criminal offenses classed as violent (murder/non-negligent manslaughter, rape, robbery, aggravated assault) for the most recent reported year. Source: U.S. Dept. of Education Campus Safety and Security (Clery Act). Counts reflect what’s reported to the school, and urban campuses often report more partly due to non-student incidents nearby — read alongside campus size and setting, not as a standalone safety verdict.
Climate
Pleasant days / yr
97
Summer high
82°F
Winter low
29°F
Annual rain
55.1"
Annual snow
19.1"
Natural-hazard risk
Relatively High
Pleasant days counts days per year with a mean temperature of 55–75°F, a high at or below 90°F, a low at or above 45°F, and little precipitation — a transparent comfort measure, not a weighting we invented. Computed from Open-Meteo ERA5 daily history (2019–2023). Natural-hazard risk is the county’s composite rating from the FEMA National Risk Index.
Deep dive — research, future-scholar output & economic mobility▾
Research output
Institutional h-index
173
Scholarly works
6,250
Institutional research volume and impact from OpenAlex. The h-index reflects large research universities and will be low for teaching-focused liberal-arts colleges — not a measure of undergraduate quality.
Economic mobility
Mobility rate
5.4%
Bottom → top quintile
37%
From bottom quintile
15%
Mobility rate = the share of students who both start in the bottom household-income quintile and reach the top quintile; bottom → top is that chance conditional on starting at the bottom. Source: Opportunity Insights Mobility Report Cards (Chetty, Friedman, Saez, Turner & Yagan). Reflects 1980–82 birth cohorts, so it’s directional, not current.
Quick answers
What is the acceptance rate at New York Institute of Technology?
New York Institute of Technology's acceptance rate is approximately 81% (Old Westbury, NY), based on the most recent figures we compiled from public and primary sources.
What SAT score do you need for New York Institute of Technology?
Admitted students at New York Institute of Technology typically score 1190–1420 on the SAT (the middle-50% range). Scores outside this band are still admitted, especially with strong applications.
How much does New York Institute of Technology cost?
At New York Institute of Technology, the average net price (after aid) is about $22,443 per year. Actual cost varies with financial aid and residency.
How many undergraduates attend New York Institute of Technology?
New York Institute of Technology enrolls approximately 3,440 undergraduate students.
Where is New York Institute of Technology located?
New York Institute of Technology is located in Old Westbury, NY.
Admissions
NYIT is a broadly accessible institution, with an admissions process that is far less selective than the region's elite private universities. The school admits the majority of its applicants, with an of 81%. The middle 50% of admitted students submit SAT scores between 1190 and 1420, and a significant portion of the incoming class presents strong academic records, with 31% reporting a GPA of 3.75 or higher and another 25% in the 3.50–3.74 range. The process does not feature an Early Decision program, and while the is a standard source for understanding factor importance, the provided sources do not specify NYIT's policy on demonstrated interest. The admissions data paints a picture of a school looking for students with solid academic preparation who are drawn to its career-oriented, technology-driven mission.
Acceptance Rate: 81%
SAT Middle 50%: 1190–1420
High-Achieving Cohort: 31% of admitted students have a GPA of 3.75+
Earnings = median of students working ~10 years after entry; debt = median of graduates. Value divides 10-yr earnings by one year’s net price — read it as earnings per dollar of annual cost, not a full lifetime ROI; it favors lower-cost schools. Source: U.S. Dept. of Education College Scorecard. Figures lag ~2 years and reflect all students, not your intended major.
$45,696
Business Administration, Management and Operations$38,289
Design and Applied Arts$37,208
Source: U.S. Dept. of Education College Scorecard (field-of-study earnings). Figures cover graduates who received federal aid and lag ~2 years; not all programs report data.
Academics at NYIT are unapologetically practical and forward-looking, built around "career-oriented, tech-infused degree programs" designed to address industry-specific questions and drive society forward. The university offers about 70 majors with a pronounced emphasis on technology, engineering, business, and health sciences. The curriculum is hands-on, with 96% of programs incorporating writing in the disciplines, 59% including service learning, and a strong focus on undergraduate research and creative projects. This applied focus is delivered in notably small classes, supported by a 12:1 student-to-faculty ratio. The academic model is explicitly about preparing graduates for the immediate demands of the workforce, particularly in high-growth tech and health fields like cybersecurity, artificial intelligence, robotics, and energy management.
Student life at NYIT is fundamentally shaped by its dual-campus structure and its overwhelmingly commuter population. The university has a significant presence at Columbus Circle in Manhattan, near Central Park, with a total enrollment of 2,427 students at that location. However, the residential experience is minimal; only 7% of students live in college-owned, -operated, or -affiliated housing, meaning 93% live off-campus. This creates a campus culture where student engagement is largely driven by daytime activities and intentional involvement. The school provides avenues for connection through student events, a wide array of clubs, leadership opportunities, and volunteer programs. The Manhattan campus's Student Activity Building offers a student lounge, recreation areas, food services, and a bookstore, serving as a central hub for the dispersed student body. The experience is less about traditional, immersive campus living and more about leveraging New York City as an extension of the classroom and professional network.
NYIT promotes strong career outcomes, particularly within its specialized, tech-heavy disciplines. The university boasts a 99.5% residency match/placement rate for its medical and health professions graduates from the Class of 2022. Its business school is ranked in the top 5% globally for salary earnings, specifically highlighting entrepreneurial studies. For all graduates, early career median earnings are reported to be about $46,000, which aligns with expectations given the mix of majors. The university's graduation rate is 59%, indicating a path where a majority of students who enroll complete their degrees. The focus is squarely on translating its applied education into tangible job placement and competitive starting salaries, especially in high-demand technical and health fields.
As a private institution, NYIT carries a significant sticker price, but it actively uses financial aid to improve accessibility. The average financial aid package for undergraduate degree-seeking students at its New York campuses exceeds $32,000. This aid brings the average —the cost after grants and scholarships—down to $22,443. The university states it offers "among the lowest net tuition rates among private" colleges in the region. Aid packages are designed to recognize scholastic achievement, service, and/or demonstrated financial need. Notably, the provided sources do not indicate that NYIT has a policy of meeting 100% of demonstrated financial need or a "no-loan" policy where loans are excluded from aid packages for certain income brackets; financial aid appears to be a mix of grants, scholarships, and loans based on eligibility.
NYIT stands out for its singular, unwavering identity as a pragmatic career launchpad. It doesn't try to be a liberal arts college or a traditional research university. Instead, it doubles down on a mission of directly feeding the tech, engineering, business, and health sectors of the New York metropolitan area and beyond. Its advantage is a sharp, applied curriculum—from AI and cybersecurity to robotics and energy management—delivered in small classes (12:1 ratio) and often tied to real-world projects and research. The dual-campus model offers a choice between a suburban Long Island setting and a prime Manhattan location at Columbus Circle, putting students in immediate proximity to industry. This comes with a trade-off: student life is overwhelmingly commuter-based (93% live off-campus), demanding more initiative to build community. For a student seeking a no-frills, professionally focused education with strong industry connections and a direct path to a career, particularly in tech or health, NYIT offers a compelling and distinct alternative to both large public universities and more theoretical private institutions.
New York Institute of Technology seal · sourceNew York City Campus Life | New York Tech · sourceOur Campuses | New York Tech · sourceNew York Institute of Technology | New York Tech · source