Admit rate has ranged 29%–50% over the last 5 years — notably volatile, though the latest figure above (26%) falls outside that window. Source: IPEDS via Urban Institute.
Acceptance & SAT from Common Data Set / IPEDS; net price, earnings & graduation from the U.S. Dept. of Education College Scorecard. Figures lag ~1–2 years — verify with the school.
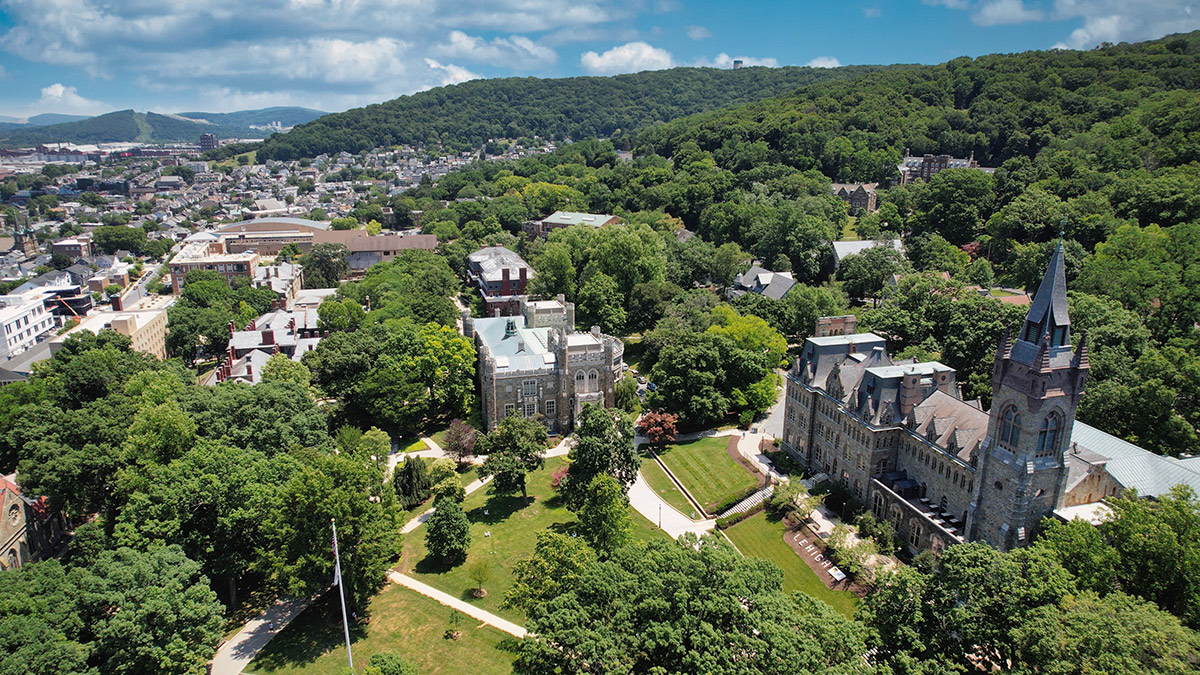
Lehigh University is a private research university in Bethlehem, Pennsylvania, where a historic strength in engineering and business meets a modern, interdisciplinary curriculum across four distinct colleges. Known for its 'work hard, play hard' culture and a campus perched on the side of a mountain, Lehigh offers a rigorous, hands-on education that reliably translates into strong career outcomes, particularly in finance, consulting, and technology. It's a place where tradition runs deep, Greek life is prominent, and the path from South Mountain to Wall Street is a well-trodden one.
Admission requirements
Test-optional — scores considered if submitted
Required
High school transcript
Grade point average
Letters of recommendation
TOEFL (non-native English)
Considered (not required)
Test scores (SAT/ACT)
College-prep program
Source: IPEDS Admissions survey (2022) via Urban Institute. Covers formal factors only — it does not reflect essays, extracurriculars, or other holistic criteria.
More details
Undergrad enrollment
5,898
In-state tuition
$64,980
Out-of-state tuition
$64,980
No-Loan Policy
Full tuition grant for families with income < $75k
Graduation Rate
88%
Meets Full Need
Yes
ED Share of Class
55-60%
On-Campus Housing
66% of students
Demonstrated Interest
Considered
Median Earnings (10yr)
$105,584
Outcomes & value
Outcomes & value
Median earnings (10 yr)
$105,584
Value (earnings ÷ net price)
2.9×
Median debt at graduation
$21,960
Graduation rate
88%
First-year retention
94%
Reducing loan balance (3 yr)
88%
Pell (lower-income) share
18%
First-gen share (among federal-aid recipients)
17%
Financial health
3.0 / 3.0Meets the federal financial-responsibility standard
U.S. Dept. of Education Financial Responsibility Composite Score (FY2022-23). Scale −1.0 to 3.0; ≥1.5 meets the standard. Reported for private nonprofit & for-profit institutions only — public universities are state-backed and not scored, so this is a stability signal, not a ranking.
Top-earning majors
Median earnings by field of study (highest credential), ~2 years after completion.
Computer and Information Sciences and Support Services, Other$81,812
Computer Science$78,552
Industrial Engineering$75,623
Chemical Engineering$74,200
Materials Engineering$74,200
Finance and Financial Management Services$74,142
Applicants here also applied to
The schools that most often appear alongside Lehigh on applicants’ lists, from our self-reported outcomes corpus.
Co-application frequency from self-reported results — directional peer discovery, not a recommendation.
Campus & location
Campus safety
On-campus violent crimes (2024)
2
Per 1,000 students
0.26
On-campus criminal offenses classed as violent (murder/non-negligent manslaughter, rape, robbery, aggravated assault) for the most recent reported year. Source: U.S. Dept. of Education Campus Safety and Security (Clery Act). Counts reflect what’s reported to the school, and urban campuses often report more partly due to non-student incidents nearby — read alongside campus size and setting, not as a standalone safety verdict.
Climate
Pleasant days / yr
89
Summer high
83°F
Winter low
27°F
Annual rain
48.2"
Annual snow
19.7"
Natural-hazard risk
Relatively Moderate
Pleasant days counts days per year with a mean temperature of 55–75°F, a high at or below 90°F, a low at or above 45°F, and little precipitation — a transparent comfort measure, not a weighting we invented. Computed from Open-Meteo ERA5 daily history (2019–2023). Natural-hazard risk is the county’s composite rating from the FEMA National Risk Index.
Deep dive — research, future-scholar output & economic mobility▾
Research output
Institutional h-index
453
Scholarly works
42,898
Institutional research volume and impact from OpenAlex. The h-index reflects large research universities and will be low for teaching-focused liberal-arts colleges — not a measure of undergraduate quality.
Economic mobility
Mobility rate
1.9%
Bottom → top quintile
57%
From bottom quintile
3%
Mobility rate = the share of students who both start in the bottom household-income quintile and reach the top quintile; bottom → top is that chance conditional on starting at the bottom. Source: Opportunity Insights Mobility Report Cards (Chetty, Friedman, Saez, Turner & Yagan). Reflects 1980–82 birth cohorts, so it’s directional, not current.
Quick answers
What is the acceptance rate at Lehigh University?
Lehigh University's acceptance rate is approximately 26% (Bethlehem, PA), based on the most recent figures we compiled from public and primary sources.
What SAT score do you need for Lehigh University?
Admitted students at Lehigh University typically score 1370–1500 on the SAT (the middle-50% range). Scores outside this band are still admitted, especially with strong applications.
How much does Lehigh University cost?
At Lehigh University, the average net price (after aid) is about $36,931 per year. Actual cost varies with financial aid and residency.
How many undergraduates attend Lehigh University?
Lehigh University enrolls approximately 5,898 undergraduate students.
Where is Lehigh University located?
Lehigh University is located in Bethlehem, PA.
Admissions
Gaining admission to Lehigh is a competitive proposition, with the university being 'quite selective.' The process is heavily influenced by the Early Decision rounds, which fill a significant portion of the incoming class. For the Class of 2028, approximately 55-60% of the freshman class was admitted via Early Decision. Historically, the Early Decision has been substantially higher than the overall rate; for the Class of 2027, it was 52.7%, compared to a 29.3% overall rate. status appears to be a considerable factor in Early Decision, with one report indicating a 96% acceptance rate for legacy ED applicants versus a 63% rate for non-legacy ED applicants.
Lehigh's admissions office considers a range of factors. According to its , academic criteria are paramount: the rigor of secondary school record, class rank, GPA, and standardized test scores are all rated as 'very important.' Application essays, recommendations, extracurricular activities, and character/personal qualities are rated as 'important.' Notably, Lehigh does consider 'demonstrated interest' as a factor in its admissions decisions. The middle 50% SAT range for admitted students is 1370–1500, indicating a high-achieving applicant pool. While the overall acceptance rate has been on a 'steady' decline, the university received over 19,000 applications for a recent cycle, admitting about 5,600 students to enroll a class of roughly 1,500.
Earnings = median of students working ~10 years after entry; debt = median of graduates. Value divides 10-yr earnings by one year’s net price — read it as earnings per dollar of annual cost, not a full lifetime ROI; it favors lower-cost schools. Source: U.S. Dept. of Education College Scorecard. Figures lag ~2 years and reflect all students, not your intended major.
Business/Managerial Economics$73,446
Computer Engineering$72,231
Source: U.S. Dept. of Education College Scorecard (field-of-study earnings). Figures cover graduates who received federal aid and lag ~2 years; not all programs report data.
Lehigh's academic structure is built around four colleges: the College of Arts and Sciences, the College of Business, the P.C. Rossin College of Engineering and Applied Science, and the College of Health. This setup fosters a flexible, interdisciplinary curriculum where students can easily cross college lines. The university offers 'more than 100 majors, minors and programs,' with particularly strong and well-known programs in engineering and business. The academic catalog notes that programs in the humanities, education, arts and sciences, and human services complement these core strengths.
The environment is described as 'rigorous' with 'very high academic standards.' A common sentiment, echoed in student reviews, is that 'your peer group is terrific everybody works hard and plays hard.' This 'work hard, play hard' ethos defines the Lehigh experience. The curriculum emphasizes hands-on learning and innovative research, with opportunities for five-year, dual-degree programs, advanced study, and experiential education. While the academic offerings are broad, some external observations note that the university's strengths are 'particularly in engineering and business.'
Life on Lehigh's hillside campus is active and heavily shaped by its social traditions. A majority of students (66%) live in college-owned, -operated, or -affiliated housing, with 34% living off campus. The university states a commitment to 'nurturing a welcoming and inclusive campus environment,' and student life is described as 'the heartbeat of campus' where students 'explore your interests, connect with others, and turn everyday moments into meaningful experiences.'
However, the social scene is often characterized by a dominant culture. Discussions among students and alumni acknowledge that 'Lehigh always needs more thoughtful students who are willing to go against the dominant culture.' Greek life is a significant presence, influencing the party and social scene. Campus amenities receive mixed reviews; an external assessment gave the campus bars and restaurants a 'C+' grade. The location in Bethlehem provides access to off-campus dining and nightlife, and the close-knit campus community fosters strong loyalties, as evidenced by the enthusiastic documentation of move-in days and campus events on the university's social media.
A Lehigh degree is a substantial financial investment that, for most graduates, pays strong dividends. The university reports that graduates secure 'high starting salaries, securing strong financial futures with an average earning potential of $77K right out of school.' The long-term payoff is even more impressive, with median earnings ten years after entry far exceeding the national average for four-year colleges.
The graduation rate is a key indicator of student success and institutional support. Lehigh's overall six-year graduation rate for a recent cohort was 85.2%. The median federal debt at graduation for students who borrow is reported to be $21,960. These metrics—high earnings, a strong graduation rate, and manageable median debt—combine to create a favorable value proposition, with one analysis concluding that while the price is high, the graduate earnings outcome is '96% above the national average.'
Lehigh is an expensive private university, with a total annual (including tuition, housing, and a meal plan) estimated by students to be in the range of $85,000 to $90,000 for those receiving no aid. However, the university has a significant financial aid program designed to improve accessibility. Lehigh is committed to 'meeting 100 percent of all students' demonstrated financial need.' This policy is a cornerstone of their financial aid offering.
For families with lower incomes, the support is even more substantial: '100% of undergraduate students from families with a total income of less than $75,000 are eligible for a full tuition grant.' The aid package is typically a combination of grants, scholarships, work-study, and loans. The university encourages all prospective students to use its official Calculator to get a personalized estimate of their out-of-pocket costs, noting that over $175 million is available in grants and scholarships. For those who do not demonstrate financial need, borrowing options like the unsubsidized Federal Direct Loan Program are available.
Lehigh stands out for its potent, career-oriented blend of top-tier engineering and business programs within a classic, residential liberal arts university structure. It’s not a sprawling research giant nor a small liberal arts college, but a distinctive hybrid where interdisciplinary study is built into the four-college model. This creates a pragmatic, hands-on academic culture that reliably funnels graduates into high-earning fields like finance, consulting, and technology, yielding some of the strongest mid-career salary outcomes among national universities.
The campus culture is equally distinctive—a famously intense 'work hard, play hard' environment set on a steep mountainside, where Greek life traditions and a strong, sometimes insular, community identity are defining features. It’s a place that cultivates deep loyalty and a powerful network, particularly along the Northeast Corridor. While it grapples with challenges around social inclusivity and campus diversity, Lehigh offers a clear, high-return proposition: a rigorous, applied education in a vibrant, tradition-rich setting that prepares students not just for their first job, but for a lifetime of above-average earnings and professional connection.
Lehigh University seal · sourceLehigh Named Among Most Beautiful Campuses | Lehigh University News · sourceClayton University Center - Shepley Bulfinch · sourceAbout the Lehigh Valley Region | P.C. Rossin College of Engineering & Applied Science · source